Realtor.com’s new report has the U.S. cash share falling and cash transactions falling faster than sales overall. Florida ranks fifth in the country, Miami leads every major metro, and more than 40% of homes sold above $1 million nationally closed without a lender.
FL Real Estate Insider — Week of September 8, 2026
By Luis Noronha
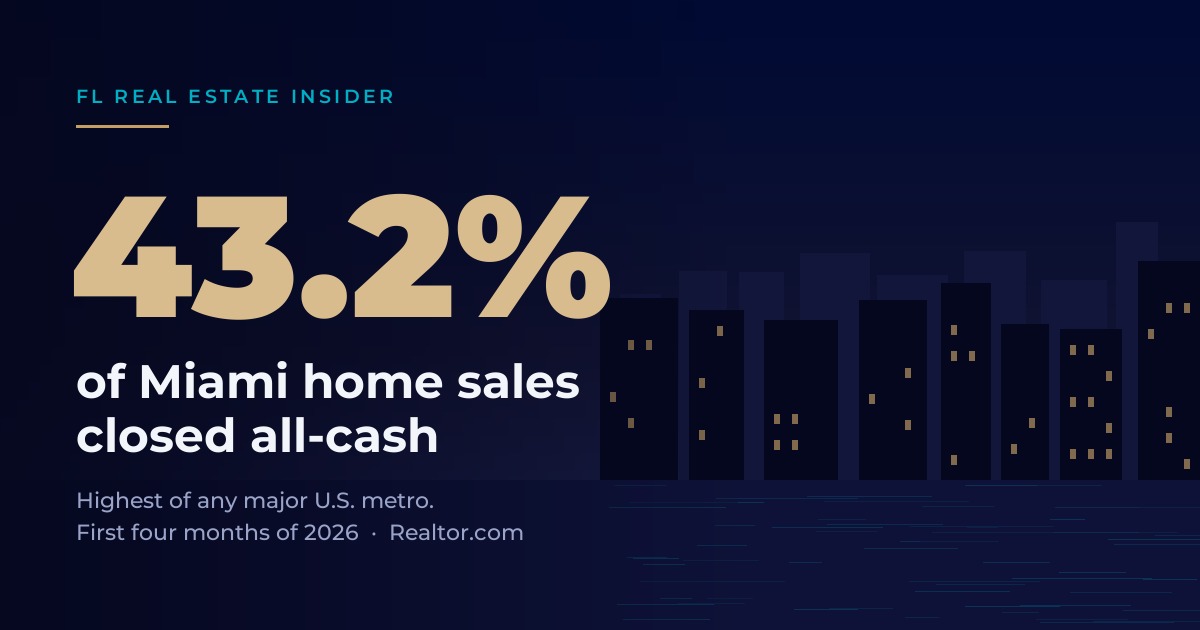
43.2%. That is the share of home sales in the Miami–Fort Lauderdale–West Palm Beach metro that closed all-cash in the first four months of 2026 — the highest of any major U.S. metro in Realtor.com’s cash-sales report released August 18, and down all of 0.3 percentage points from a year earlier. (Realtor.com, August 18, 2026)
Nationally, cash buying is in retreat. In Miami it barely moved.
The national retreat is real, and it’s faster than the market
Start with the part I read as bad news for the cash buyer’s leverage — my read, not the report’s.
Cash purchases were 31.4% of U.S. home sales in the first four months of 2026, down from 32.3% in the same window a year earlier: a decline of 0.9 percentage points. And the drop in the number of cash transactions outran the drop in the market itself. Total home sales fell 8.5% year over year. Cash sales fell 11.2% — a gap of 2.7 points. Meanwhile the national median sale price rose 0.2%, against 1.8% growth in 2025 and a 15.4% peak in 2021.
Hannah Jones, senior economist at Realtor.com, put it this way:
“Cash buyers aren’t disappearing; they’re simply becoming less dominant as the housing market finds its footing. More inventory and moderating prices are giving financed buyers more opportunities to compete.”
That is the framing I saw picked up in most of the coverage I read, and on the national numbers I think it holds.
Here’s the table I haven’t seen anyone quote
Underneath the national number is a state table, and Florida is near the top of it.
The highest cash shares were Mississippi (47.2%), Montana (45.9%), New Mexico (43.8%), Missouri (42.0%) and Florida (41.3%) — Florida fifth in the country, and 9.9 points above the 31.4% national share.
The Florida metros:
- Miami–Fort Lauderdale–West Palm Beach — 43.2%, down 0.3 points, first among all major metros
- Tampa–St. Petersburg–Clearwater — 35.1%, down 0.5 points
- Orlando–Kissimmee–Sanford — 32.7%, up 0.2 points
- Jacksonville — 31.7%, down 1.5 points
All four sit above the national share.
Orlando’s went up, against the national direction — and it is not alone. The report has a whole section on markets moving the other way, naming Pittsburgh (up 6.8 points, the largest increase among major metros), Austin, and San Francisco, where cash purchases rose 7.7% year over year. At the other end sit the “high-cost job centers… where mortgage-reliant buyers make up a larger share of purchasers”: Seattle 16.4%, Washington D.C. 18.2%, Denver 18.8%, San Jose 20.2%.
My read: what matters here isn’t Miami’s level, it’s Miami’s slope. The country gave back 0.9 points of cash share. Miami gave back 0.3 — a third as much, off the highest metro base in the country. To me that reads as a cohort not being replaced by financed buyers at anything like the national rate, though a share movement on its own can’t establish that.
The tier this newsletter is written for
Cash is concentrated at both ends of the market — what the report calls a U-shaped pattern. More than two-thirds of homes below $100,000 were cash. And at the top, nationally:
“More than 40% of homes sold for more than $1 million and a majority of homes sold for $2 million or more were purchased without financing.”
Realtor.com’s explanation runs one sentence: “At the luxury end, affluent households are more likely to have the resources to purchase homes outright.” In my view that one sentence is the whole thesis of this issue.
I weight this dataset more heavily than a survey, and it’s worth saying why. The analysis uses recorded deeds back to 2001, and a sale counts as all-cash “when the recorded transaction shows no evidence of a mortgage lien at closing.” It counts what was recorded at the closing table, not what a buyer told a survey panel. One caveat I’d own: no recorded lien is a proxy for cash, not a direct observation of it.
I read that instrument difference as the main reason 31.4% sits well above the roughly 25% national cash share I quoted in June’s issue on the Florida luxury buyer. That figure was NAR survey data for a single month — MIAMI REALTORS® carried it at about 25% in its June-data release and about 26% in its July-data release — against a four-month deed count here. Different instruments, different windows, measuring the same thing. I should have said so in June.
What the same market looks like from the financed side
Freddie Mac’s 30-year fixed averaged 6.71% for the week ending September 3 — up from 6.66% the prior week, and 21 basis points above the 6.50% of a year ago. (Freddie Mac PMMS)
My read is that the builders selling to that financed buyer are paying for the privilege. The NAHB/Wells Fargo index came in at 35 in August, the sixteenth consecutive month below 40, with 35% of builders cutting prices at an average reduction of 6% and 63% using sales incentives. (NAHB, August 17, 2026) NAHB Chief Economist Robert Dietz, in the same release:
“Custom home builders continue to report stronger market conditions than spec builders, reflecting better conditions at the higher end of the market.”
Here is the picture I put together from those two datasets — a construction of mine, not a finding of either source. The NAHB index is national and monthly; the cash shares are Florida metros over four months. Different instruments, different windows. With that said: one business is buying down a rate to close a financed buyer, and the other is transacting with someone who never opened a rate sheet — the buyer I described in June.
The tables that argue against me
Four limits, and one of them is the sharpest number in this issue.
One: Realtor.com does not credit new construction for Florida’s share, and the dataset has no new-build cut at all. The report says plainly that “Florida’s retiree and second-home buyer base supports elevated cash activity.” Not developers. Not new product. There is no new-construction cash share in it — national, state or metro. I looked for one. It does not exist in this dataset, and I’m not going to manufacture one by inference.
Two: the window closed in April. First four months of 2026, on recorded deeds. Everything since — including a mortgage rate that has gone up, not down — sits outside it.
Three: Miami’s cash share fell, and on our own preferred series it fell harder than 0.3 points. MIAMI REALTORS® reported Miami-Dade cash at 38.1% of closed sales in June 2026 and 35.1% in July — down 3.0 points in a single month, with single-family cash falling from 27.6% to 21.2%, a 6.4-point drop, and condo cash easing from 48.5% to 47.5%. (MIAMI REALTORS®, June 2026 data · July 2026 data) That is two months of one county on small counts, not a trend — but it is the number a reader with my June issue open will find, so I’d rather hand it to you myself.
Four: Jones’s read may simply be the right one. A more diverse buyer pool, she says, “is a positive sign for market activity.” “When more buyers can compete using different paths to purchase, the market has the potential to become healthier and more balanced.” My bet, and I’ll call it a bet rather than a finding: a healthier market with more financed buyers in it does not threaten well-located, code-current product.
One rule I’d ask you to apply to all of the above: don’t blend these numbers. Realtor.com’s 43.2% is the metro, January–April, from deeds. MIAMI’s 35.1% is Miami-Dade, July, from the MLS — and it is a coincidence, not a relationship, that Tampa’s metro figure is also 35.1%. Neither belongs anywhere near the 82% all-cash figure MIAMI publishes for $1 million-and-up condo sales in 2025. Different tier, different year, different product.
What the July Miami-Dade data does add is the leg Realtor.com’s April cutoff can’t reach: $1 million-and-up sales rose 15.5% year over year, from 341 to 394. Statewide, closed sales of existing single-family homes reached 23,870 in July, up 5.1%, at a median of $425,000. (Florida Realtors, August 17, 2026) That volume closed with the 30-year fixed printing between 6.43% and 6.66% every week of July, and 6.47%–6.52% through June, when those contracts would have been signed. (Freddie Mac PMMS via FRED, MORTGAGE30US) No rate relief in it.
From the Developer’s Seat
Everything below this line is opinion — mine, not statute, not data, and not something any source above said. I want that marked plainly.
Five weeks ago I argued in this newsletter that nobody should underwrite a Florida project on the assumption of Fed relief, and seven days before the FOMC decides, these tables are why I still hold that position. In a state where 41.3% of closings in the first four months of 2026 never touched a lender, and in a national million-dollar-plus tier where more than four in ten didn’t either, the policy rate is a second-tier variable for this segment rather than the master variable. The Miami-Dade single-family cash share falling to 21.2% in July is the number that argues hardest against me, and I’d still hold the position: two months of one county is not a series, and the four-month deed count underneath it is. That is not an argument for ignoring rates — it is an argument about which buyer you build for, and code-current, ground-up new product is exactly what that cash-heavy end buyer is competing over: no unfunded reserves, no deferred maintenance, no financing contingency to blow up three weeks before closing. I’d rather own a smaller, better-built position sold to someone who never needed a lender than a bigger one that only works if the Fed cooperates. My rule is the boring one: underwrite the end buyer, not the rate.
So — a question I’d genuinely like answered: does the last Florida deal you underwrote assume a financed exit? I read every reply.
If you want to see how that assumption shows up in live underwriting — the actual end-buyer profile, the actual capital stack — that’s the conversation the Lana Investor Memo exists for.
→ Request access at coastal-living-collection.com (accredited investors only).
Until next week,
Luis
Sources
- Realtor.com® — Cash Buyers Pull Back Faster Than Housing Market as Cash Sales Fade (August 18, 2026) · underlying research page: realtor.com/research/all-cash-sale-trends-august-2026
- Freddie Mac — Primary Mortgage Market Survey (week ending September 3, 2026)
- Freddie Mac 30-Year Fixed Rate Mortgage Average (MORTGAGE30US), weekly series via FRED
- NAHB — Affordability Pressures Keep Builder Confidence Low (August 17, 2026)
- MIAMI REALTORS® — June 2026 data: Miami-Dade Real Estate Posts Best June in Three Years (released July 2026)
- MIAMI REALTORS® — July 2026 data: Miami-Dade Total Home Sales Rise for 11th Consecutive Month (August 17, 2026)
- Florida Realtors — Fla.’s Housing Market: Closed Sales and New Pending Sales Rise in July (August 17, 2026)
- Prior published: The Fed Held Rates Last Week — and Three Officials Voted to Raise Them (August 3, 2026) · The Florida Luxury Buyer in 2026 (June 8, 2026)