← Lana Development | Projects | Contact

Tag: Construction costs

  • Florida Has Become the Epicenter of Construction Labor Enforcement. The Builders Who Survive Are Not Who You Think.

    Florida Has Become the Epicenter of Construction Labor Enforcement. The Builders Who Survive Are Not Who You Think.

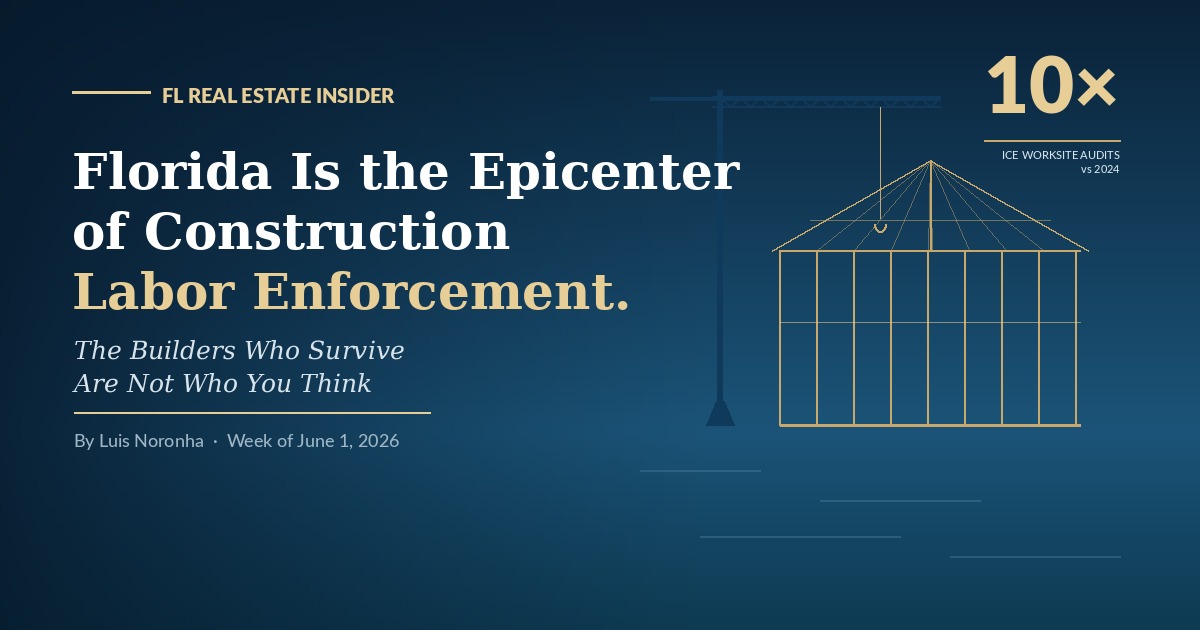
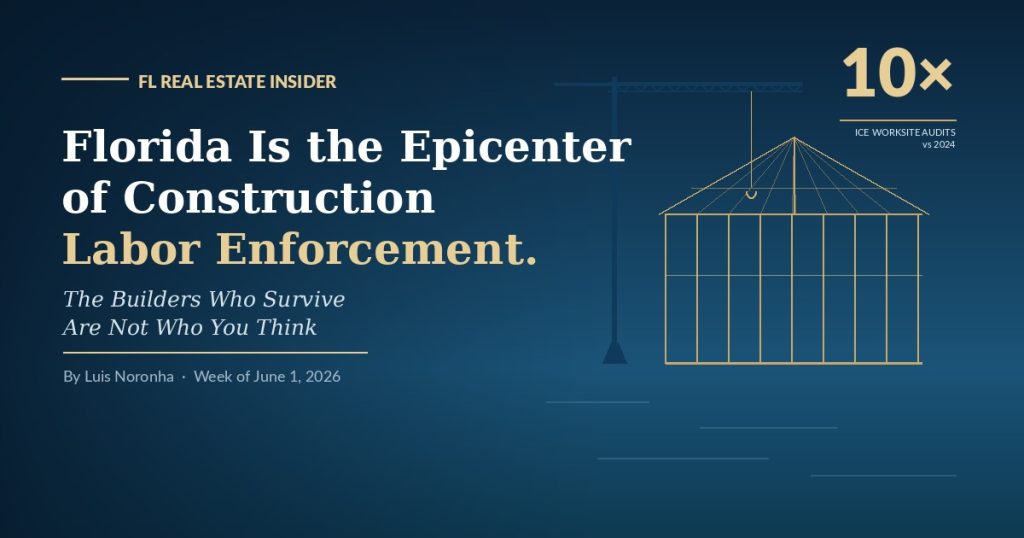
    Florida construction labor enforcement under SB 1718 — unfinished frame and idle crane, 10× ICE audit pace

    Three years of SB 1718, a 10-to-1 lead in 287(g) partnerships, and an ICE Notice-of-Inspection rate running ten times the 2024 pace are not punishing every Florida builder equally — they are quietly finishing what the rate cycle started.

    FL Real Estate Insider — Week of June 1, 2026 By Luis Noronha


    There is a number that should be the lead in every Florida real estate publication this June and is in almost none of them: as of June 11, 2025, Florida — three years into SB 1718 — had 295 active or pending 287(g) memorandums of agreement with ICE — more than three times the 95 in Texas and nearly nine times the 33 in Georgia. (Roofing Contractor — Florida Emerges as the Epicenter of ICE Raids)

    That is not a marginal data point. That is the formal infrastructure of a worksite-enforcement regime that has, over the past fifteen months, made Florida the single most active state in the country for construction-site immigration action — by a margin of at least 10-to-1 compared to the next-closest state. (Roofing Contractor — Florida Emerges as the Epicenter of ICE Raids)

    I want to lay out what the enforcement data actually shows, what the labor data actually says about Florida residential construction, who in the builder ecosystem absorbs the shock and who does not, and — clearly marked as opinion at the end — what I think it means for capital deployed into ground-up Florida new construction over the next 24 months.

    This piece is a direct continuation of the May 25 issue (Florida New Construction Is Down 31%. The Builders Who Survived Are Not Who You Think.). Last week I argued that the cost-of-capital wedge between the national publics and the mid-market private builder cohort is the single most under-appreciated story in Florida residential right now. The labor data published since then makes the same argument from the input-cost side. Read together, they tell a coherent story most coverage is still missing.


    What the SB 1718 enforcement infrastructure actually looks like

    The legal and operational machinery has three layers and all three matter.

    Layer one — the statute. Governor DeSantis signed Senate Bill 1718 into law on May 10, 2023. The E-Verify requirement for private employers with 25 or more employees took effect July 1, 2023. The enforcement window — fines of $1,000 per day plus suspension of state-issued licenses for employers who fail to comply three times in any 24-month period — became operative July 1, 2024. (Greenberg Traurig — E-Verify: Florida Senate Passes Bill Requiring State Employers With 25 or More Employees to Use Platform Effective July 1, Bilzin Sumberg — Florida Law Imposes Additional E-Verify Requirements for Private Employers, Florida Senate — SB 1718 (2023) Enrolled Text)

    Layer two — the federal operations. ICE’s rate of Notices of Inspection — the audit instrument that drives the bulk of worksite enforcement — ran in the first half of 2025 at least ten times the 2024 rate, with that pace expected to continue or accelerate through 2026 as funding expands and federal data-sharing agreements (including the recent IRS arrangement) come online. (American Immigration Council — Understanding ICE Raids at American Workplaces (October 2025 fact sheet))

    Layer three — the named operations in Florida. The pattern is no longer theoretical. ICE Tampa’s Operation Tidal Wave in late May 2025 resulted in 1,120 arrests of removable individuals — the largest joint immigration operation in Florida history, per ICE. (ICE — ICE Tampa Conducts Worksite Enforcement at Rapidly Expanding Community, Arrests 33 Illegal Aliens) On May 29, 2025, ICE raided the FSU College Town construction site in Tallahassee and detained more than 100 workers in a single action. (Florida Phoenix — ICE Raids FSU College Town Construction Site, Buses Away Workers)

    The three layers compound. The statute creates the compliance obligation, the federal audit cycle creates the documentation pressure, and the named operations create the day-to-day fear that disrupts crews independent of any individual worker’s status.


    What the labor data actually says

    The industry-level numbers are large and they are not improving.

    The Associated Builders and Contractors estimates the U.S. construction industry must attract roughly 349,000 net new workers in 2026 just to meet demand, with that figure projected to rise to 456,000 in 2027 — a structural gap, not a cyclical one. (Construction Owners — Construction Workforce Crisis Deepens in 2026 Amid Labor Shortages and ICE Raids)

    Recent industry-survey work shows 28% of construction firms experienced workforce disruption tied to ICE enforcement in the past six months, approximately 10% lost workers directly to enforcement actions or rumors of raids, and another 20% reported that their subcontractors had lost workers. (Construction Owners — Construction Workforce Crisis Deepens in 2026)

    The structural exposure is concentrated where Florida residential construction actually happens. Immigrants comprise approximately 34% of all U.S. construction workers, with shares above 60% in drywall, roofing, and plastering trades, and in Florida specifically the share approaches or exceeds 40% across the residential build cycle. (Construction Owners — Construction Workforce Crisis Deepens in 2026, Construction Dive — ICE Raids on Building Sites Stoke Fear, Uncertainty)

    Independent economic analysis estimates the Florida labor shortage alone could push the state’s GDP down by roughly $12.6 billion in a single year — about 1.1% of the state economy. (Bloomberg Línea — Which Sectors Are More Exposed to Florida’s New SB 1718 Laws?)

    The honest read is straightforward. A statutory employment regime that disqualifies a meaningful slice of the residential trades labor pool, layered on top of a federal enforcement cycle running ten times the 2024 audit pace, layered on top of a Florida-specific 287(g) infrastructure that is the densest in the country, does not produce a marginal labor shortage. It produces a structural one. And that shortage shows up first and hardest in the trades that drive the Florida residential build cycle.


    Who can absorb the shock

    This is where the May 25 builder-consolidation analysis becomes important.

    The national publics with self-perform crews, in-house framing and concrete divisions, captive subcontractor relationships, and balance-sheet capacity to over-hire ahead of crew shortages have a structural cushion the private mid-market builder does not. Lennar reported Q1 2026 net earnings of $0.93 per diluted share — a 57% decline from $2.14 in Q1 2025 — but new orders nonetheless grew 1% year-over-year to 18,515 homes. (Lennar — Lennar Reports First Quarter 2026 Results (March 12, 2026)) PulteGroup reported Q1 2026 home sale revenues of $3.3 billion — down 12% year-over-year — with closings down 7% to 6,102 homes and average selling price down 5% to $542,000. (TradingView — PulteGroup Stock Down on Earnings Q1 Miss, Revenues Beat on Orders) D.R. Horton’s guidance for fiscal 2026 closings is 86,000 to 87,500 homes — close to flat against fiscal 2025’s 84,863 closings. (D.R. Horton — Q1 FY2026 Earnings Release)

    The pattern is the same on the cost side as it was on the demand side: margin compression at the publics, with volume intact. The publics are taking the labor and incentive hit through reduced earnings per share, not through reduced production. They can do that because their scale lets them.

    The mid-market private builder running the same project against the same labor environment cannot.

    The 2025 Florida builder-failure list I cited in last week’s issue makes the contrast plain — Pegasus Builders (Chapter 11 mid-2025, ~$10M debts), Van Der Valk Construction (Chapter 11 April 30, 2025, 58 homeowners affected), Sion Homes (Chapter 7 September 2025, liabilities over $1M against less than $1,000 cash), Phil Kean Designs Inc. (Chapter 11 Subchapter V late November 2025). (Medium — Luxury Home Builders Collapse Across Florida Amid Market Shifts, TheStreet — Luxury Homebuilder Files for Chapter 11 Bankruptcy) Every one of these is a builder with a long track record — and every one of them was operating in the price tier where labor cost is a meaningful share of finished value and the captive-crew advantage of the publics is decisive.

    The mechanism is straightforward. When a Lennar or D.R. Horton project loses framing crew capacity to an enforcement event, the parent company can redirect from another active project, draw on a captive sub network with national reach, or run a forced-buyout incentive package on the next start window to retain crews. The mid-market private builder running off three or four open-market trade partners on a single project does not have any of those levers. The crew that walked off on Tuesday morning does not come back on Wednesday at the same cost basis.

    That is the labor side of the cost-of-capital wedge. The May 25 piece described the financial side — rate-buydown subsidies the publics can offer that the private cannot, land-banking pipelines the publics access through institutional partners the private cannot, mortgage-subsidiary captive financing the private has no analog to. The labor side now sits alongside those three: a fourth structural advantage that flows mechanically to scale, and a fourth structural disadvantage that flows mechanically to anyone without it.


    What this is doing to the surviving lane

    Now I want to clearly mark what follows as my view, not statute.

    The labor crunch, like the financial wedges I wrote about last week, is reshaping the competitive set of Florida residential builders far more aggressively than it is reshaping the demand for code-current new construction. The two effects are not the same and they should be priced separately.

    On the demand side, the labor disruption matters surprisingly little for the HNWI move-up buyer. A buyer absorbing a $1.5M to $4M asset is not price-elastic on a $10,000 to $40,000 finished-cost delta tied to labor pass-through. The end-buyer pool for code-current new construction in the corridors where this matters — Galleria Villages, Turquoise Homes, Waterview, West Bay — is dominated by buyers who pay cash or carry low leverage and who care more about delivery quality and timing than about the marginal cost line. The labor crunch may stretch delivery, but it does not break absorption in this tier.

    On the supply side, the labor disruption matters enormously, but the wedge it creates favors the surviving cohort. The national publics absorb the cost through margin compression and keep producing volume in the merchant-build price tier. The disciplined private developer operating in the HNWI move-up tier passes a portion of the cost through to a buyer who is largely insensitive to it, and protects the rest through trade-partner relationships built over years of consistent delivery. The mid-market private builder running merchant-build economics with open-market crews is the cohort being eliminated.

    That is — in my view — exactly the right competitive set for Florida residential to settle into. Volume merchant-build product needs the scale advantages of the publics to be delivered profitably. The HNWI move-up tier needs the discipline and trade-partner depth of an established private developer that does not need to compete on volume. The mid-market merchant-build segment — the lane that has been hollowing out — was always the structurally weakest because it lacked both the scale of the publics and the price-tier insulation of the disciplined private.


    From the Developer’s Seat

    The labor regime in Florida is not going to ease over the 24-month horizon any disciplined capital allocator should be underwriting against. The statute is in place, the enforcement infrastructure is the densest in the country, and the federal audit pace is structurally higher than it was 18 months ago. Capital deployed into Florida residential between now and the back half of 2027 has to be priced against that reality.

    My view — clearly marked as opinion — is that the labor crunch is one more reason the right structure for Florida residential capital today is patient HNWI and family-office co-investment alongside a disciplined developer operating in the HNWI move-up tier. The leveraged merchant-build lane is exposed to a wedge it cannot close. The volume merchant-build lane is reserved for the publics that have the scale to absorb it. The HNWI lane has the price-tier insulation, the trade-partner relationships, and the patience that the moment actually rewards.

    If you are an accredited investor evaluating Florida residential allocation against this backdrop, I would rather show you the underwriting than argue with you about it. The Lana Investor Memo lays out our active pipeline, the specific projects, the named underwriting, and the structure we use to invest alongside HNWI and family-office capital. It is private, accredited-only, and shared with serious allocators. Reply to this email if you would like to opt in.


    Sources

  • Florida New Construction Is Down 31%. The Builders Who Survived Are Not Who You Think.

    Florida New Construction Is Down 31%. The Builders Who Survived Are Not Who You Think.

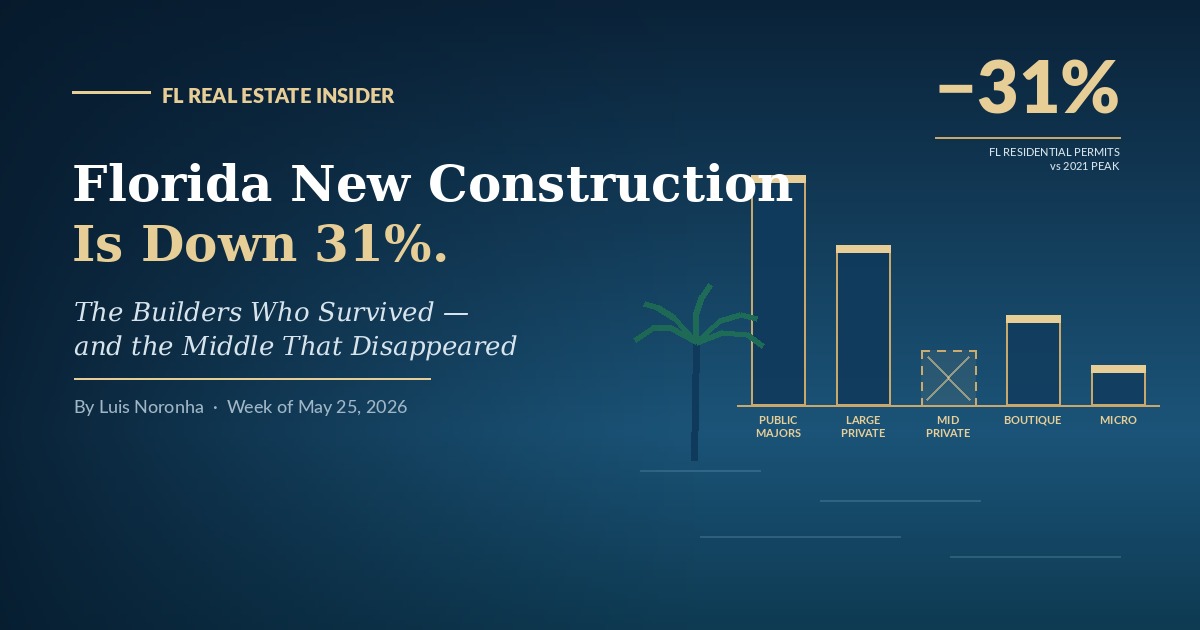
    Florida new construction down 31% — bar chart with hollowed-out mid-market builder tier

    Why the only Florida operators left standing are the very largest publics, the very disciplined privates, and almost no one in between — and what that gap means for capital.

    FL Real Estate Insider — Week of May 25, 2026 By Luis Noronha


    A number that should be on the front page of every Florida real estate publication this spring, and instead is in almost none of them: Florida residential building permits are down roughly 31% from the 2021 peak. (Shovels — Florida Housing Market Outlook: What Building Permit Data Says)

    That is not a normal-cycle slowdown. That is a structural reset of the supply side of the Florida new construction market, and the part of the story that nobody is telling cleanly is who is still building and who is not.

    This week I want to lay out what the permit data actually shows, what the public homebuilders’ first-quarter 2026 earnings actually say about Florida, what is happening to the private builder cohort that used to fill the middle of this market, and — clearly marked as opinion — what I think it means for capital allocated to ground-up Florida new construction over the next 24 months.


    What the Florida new construction volume numbers actually say

    Shovels’ Florida permit dataset shows roughly 66,460 new residential construction permits reviewed in 2025, down from 96,951 in 2023 — a 31% reduction in volume. The cycle low was 2024, when the year-over-year drop hit 21%; 2025 ticked up 1.4%, which is meaningful as a floor signal but is a long way from a recovery. (Shovels — Florida Housing Market Outlook)

    The U.S. Census Bureau’s monthly Building Permits Survey for Florida confirms the directional read in the official federal data and is the place to verify any single-month or single-county number. (U.S. Census Bureau — Building Permits Survey, State Monthly, FRED — New Private Housing Units Authorized by Building Permits for Florida (FLBPPRIV))

    The headline read most coverage settles on is “Florida is overbuilt and needs to absorb.” That is half right. The state did overbuild specific submarkets in 2021–2022 — Southwest Florida especially — and the inventory in those metros is still working off. But the permit number is a forward indicator of supply, not a backward indicator of absorption, and what it is telling you is that the operators who can pull permits at scale in Florida today are a much smaller and much more concentrated group than they were four years ago.


    Who is still building: the publics are eating the market

    Inside Florida, the share concentration at the top is severe. Lennar led Florida permits in early 2026 at roughly 1,111 permits, D.R. Horton at 690, PulteGroup at 379. (HBWeekly — Florida’s Top Home Builders, December 2025 Market Snapshot, HBWeekly — Florida Top Home Builders, January 2026) Nationally, D.R. Horton closed more than 87,000 homes in 2025 — the No. 1 spot it took from Lennar two years earlier. (Builder Magazine — The 5 Home Builders Leading the Nation in Closings)

    That concentration is being held up by an incentive package smaller competitors cannot match. Lennar reported Q1 2026 sales incentives at roughly 14% of sales price, against a historical average of 4% to 6%, and new orders nonetheless grew 1% year-over-year to 18,515 homes. (Lennar — Form 10-Q for the quarter ended February 28, 2026, FinancialContent — Lennar Q1 Earnings Signal Shift in Housing Market) D.R. Horton’s Q1 2026 homebuilding revenue fell 9% to $6.5 billion and pre-tax homebuilding income fell 30% — yet new sales orders were up year-over-year. (D.R. Horton — Q1 FY2026 Earnings Release)

    The mechanism is the captive mortgage subsidiary. DHI Mortgage, Lennar Mortgage, and Pulte Mortgage can deliver below-market rate buydowns — typically 100 to 200 basis points, plus closing-cost credits — on the parent’s own inventory, financed off the parent’s balance sheet. (The Globe and Mail — Homebuilder Earnings: D.R. Horton Sticks Out as Pulte & NVR Sales Tank) A small or mid-sized private builder cannot match that package without taking the project to a loss.


    The land-banking layer that institutionalized the gap

    The second structural advantage is one almost no consumer-facing Florida real estate coverage has connected to homebuyer outcomes: the land-banking spin-off model.

    On February 7, 2025, Lennar completed the taxable spin-off of Millrose Properties, advancing what it has called since 2013 a strategy of becoming a “pure-play land-light manufacturer of homes.” Millrose buys and develops residential land, then sells finished homesites back to Lennar under option contracts with predetermined costs and takedown schedules. It is externally managed by Kennedy Lewis Land and Residential Advisors, an affiliate of Kennedy Lewis Investment Management — an institutional firm with more than $25 billion in assets under management. (Lennar — Lennar Completes Spin-off of Millrose Properties (Feb 7, 2025), SEC — Millrose Properties Form 424B1, FY2025)

    A mid-sized Florida private builder bidding against a Millrose-funded lot takedown is, in effect, bidding against Kennedy Lewis. Industry coverage of the broader sector notes that “you can’t attend an industry conference without encountering multiple new land bank funds.” (HousingWire — Understanding Homebuilding’s New Capital Partner: Land Banking, John Burns Research and Consulting — Land Banking Grows as Housing Industry Strategy)


    The private-builder cohort being squeezed

    The other end of the same trend is now showing up in the bankruptcy docket. The Florida 2025 builder-failure list is not a list of small operators that got over their skis — it is a list of well-known builders with long track records:

    The common factors in the post-mortems are not surprising — insurance during construction roughly doubled across the 2022–2024 cycle, materials cost volatility caught builders working off fixed-price contracts, and labor markets stayed tight — but the structural explanation is the cost-of-capital gap. When the largest publics can self-fund a rate buydown, schedule a finished lot off an institutional land bank, and underwrite a project on volume economics, the private builder running the same project off a regional bank construction loan and a self-financed lot is competing on a different P&L.

    Industry M&A is the next step in the same pattern. New Home Co. completed its acquisition of Landsea Homes Corporation in early 2026, creating a privately-held top-25 national homebuilder — a transaction explicitly framed by both parties as a defensive response to scale-driven cost-of-capital pressure. (Rise Well Homes — New Home Co. Completes Acquisition of Landsea Homes Corporation)


    The lane the publics structurally don’t serve

    Here is the part of the story that matters for the audience this newsletter is actually written for.

    The volume-merchant new-construction model the publics run in Florida — D.R. Horton’s median price tier, Lennar’s median tier, Pulte’s median tier, plus the rate-buydown package — is overwhelmingly aimed at the first-time and first move-up financed buyer below the conforming loan limit. It is built around mortgage origination. It is not built around the buyer profile that is currently driving the Florida price tiers that are not softening.

    That buyer profile is cash. I am going to stay on one county and one tier for all of it, because mixing geographies and price tiers is exactly how this gets overstated — and Miami-Dade is the only Florida county publishing a verifiable cash share at the top of the market:

    • 82% of Miami-Dade $1 million-and-up condo sales closed all-cash in 2025, against a national all-price share of roughly 25%. Four in five transactions in that tier never touch a lender. (MIAMI REALTORS®)
    • Below the luxury tier the county still runs far above the national norm: cash was 38.1% of all Miami-Dade closed sales in June 2026 — 48.5% of existing condo sales and 27.6% of single-family. (MIAMI REALTORS®) Miami-Dade posted a 40% cash share in December 2025 against a 27% national average. (MILLION)
    • And the tier is growing, not shrinking: in the second quarter of 2026, $1 million-plus sales across Miami-Dade, Broward, Palm Beach, the Treasure Coast and Southwest Florida rose 20.1% to 8,013 single-family homes and 23.5% to 2,590 condos. (Keyes/Illustrated Luxury Market Report, Q2 2026, via RISMedia)

    Two honest limits on that. It is one county — no comparable cash share is published for Palm Beach or Southwest Florida, and on volume those markets are larger at the top than Miami-Dade is. And the 82% is a condo figure; no matching number exists for million-dollar single-family. I would rather give you a narrow number that holds than a statewide one that does not.

    The customer in those numbers does not need a 200-basis-point rate buydown. The captive-mortgage advantage that the publics use to dominate the first-time-buyer market is irrelevant to a cash buyer at the top of the market. And the volume-merchant production model the publics run is structurally bad at producing the customized, code-current, primary-residence product that cash cohort actually wants — partly because it does not match their distribution, partly because the margin math on a custom-spec project does not fit a public homebuilder’s quarterly earnings cycle, and partly because the publics have spent the last decade explicitly de-emphasizing the land-heavy custom-spec model in favor of asset-light merchant-build.

    That is the lane.


    What I think — clearly marked as opinion

    I want to clearly mark what follows as my view, not data.

    Read together, the 31% permit decline, the public-builder incentive escalation, the land-banking buildout, and the private-builder failure list are not four separate stories. They are one story: the Florida new-construction supply side is being squeezed into two viable lanes and hollowed out everywhere in between.

    Lane one is the merchant-build volume tier the publics dominate, and they will keep dominating it. Trying to compete with D.R. Horton in 2026–2027 on a 25-home subdivision priced at a first-time-buyer mortgage is, for almost any private builder, a strategic mistake.

    Lane two — the one that matters to a serious capital allocator — is custom-spec, code-current, primary-residence product priced for the cash and HNWI move-up buyer. That lane has three durable advantages right now that I do not believe are temporary:

    First, the end buyer pays cash, so the rate-buydown dynamic that decides the financed tiers does not apply. Lane two competes on product, location, and execution.

    Second, the supply side in lane two has measurably thinned as the small and mid-sized private builders who used to fill it either failed, sold to a larger platform, or moved into project-management work for a public. Less competition for the same end-buyer demand is the most direct definition of pricing power I can give you.

    Third, the structural tailwinds I have flagged in recent issues — the insurance wedge in favor of code-current construction, the GSE underwriting wedge in favor of code-current condos, the property-tax reform conversation that disproportionately rewards homesteaded primary residences — all flow through this exact lane. (Background: The Florida Property Tax Fight, Without the Talking Points, The Condo Cliff, Wall Street Landlords.)

    The counterpoint to my own thesis: this is not a permanent moat. The publics are smart, the institutional land-bank vehicles will eventually reach further up the price tier, and the cash-buyer pool can soften if global liquidity conditions change. The reading I am giving you is a 24-to-36-month view, not a 10-year view. But on that horizon, the structural setup is as favorable as I have seen it in this cycle.


    From the Developer’s Seat

    This section is my view, not data.

    The single sentence I would offer a sophisticated capital allocator looking at Florida new construction right now: the operators left standing in the lane I would want to deploy into are a much smaller, much more identifiable group than they were three years ago — and the structural advantages of being in that group are widening, not narrowing.

    Patient, code-current, custom-spec primary-residence development priced for the HNWI move-up and cash buyer is the lane Lana is built for. It is also the lane in which family-office and HNWI capital — patient, willing to underwrite a 24-month ground-up cycle, earning co-invest economics no institutional REIT can match — has its largest structural edge.

    If you are an accredited investor and want to see how this thesis is expressed in named, live Lana projects with full underwriting transparency, that is what the Lana Investor Memo exists for. Reply to this email and I will add you to the next memo distribution.


    Sources

  • Rising Construction Costs

    Rising Construction Costs

    The latest round of U.S. tariffs is reverberating across the real estate and construction sectors—and for investors, the message is clear: rising construction costs.

    Underwriting assumptions need to evolve.

    Over the past few months, the relentless inflation of material costs has been chipping away at margins and disrupting timelines across almost all asset classes. Whether you’re supporting residential communities, build-to-rent portfolios, or mixed-use developments, the impact is starkly evident in the financials.

    What’s Changing?

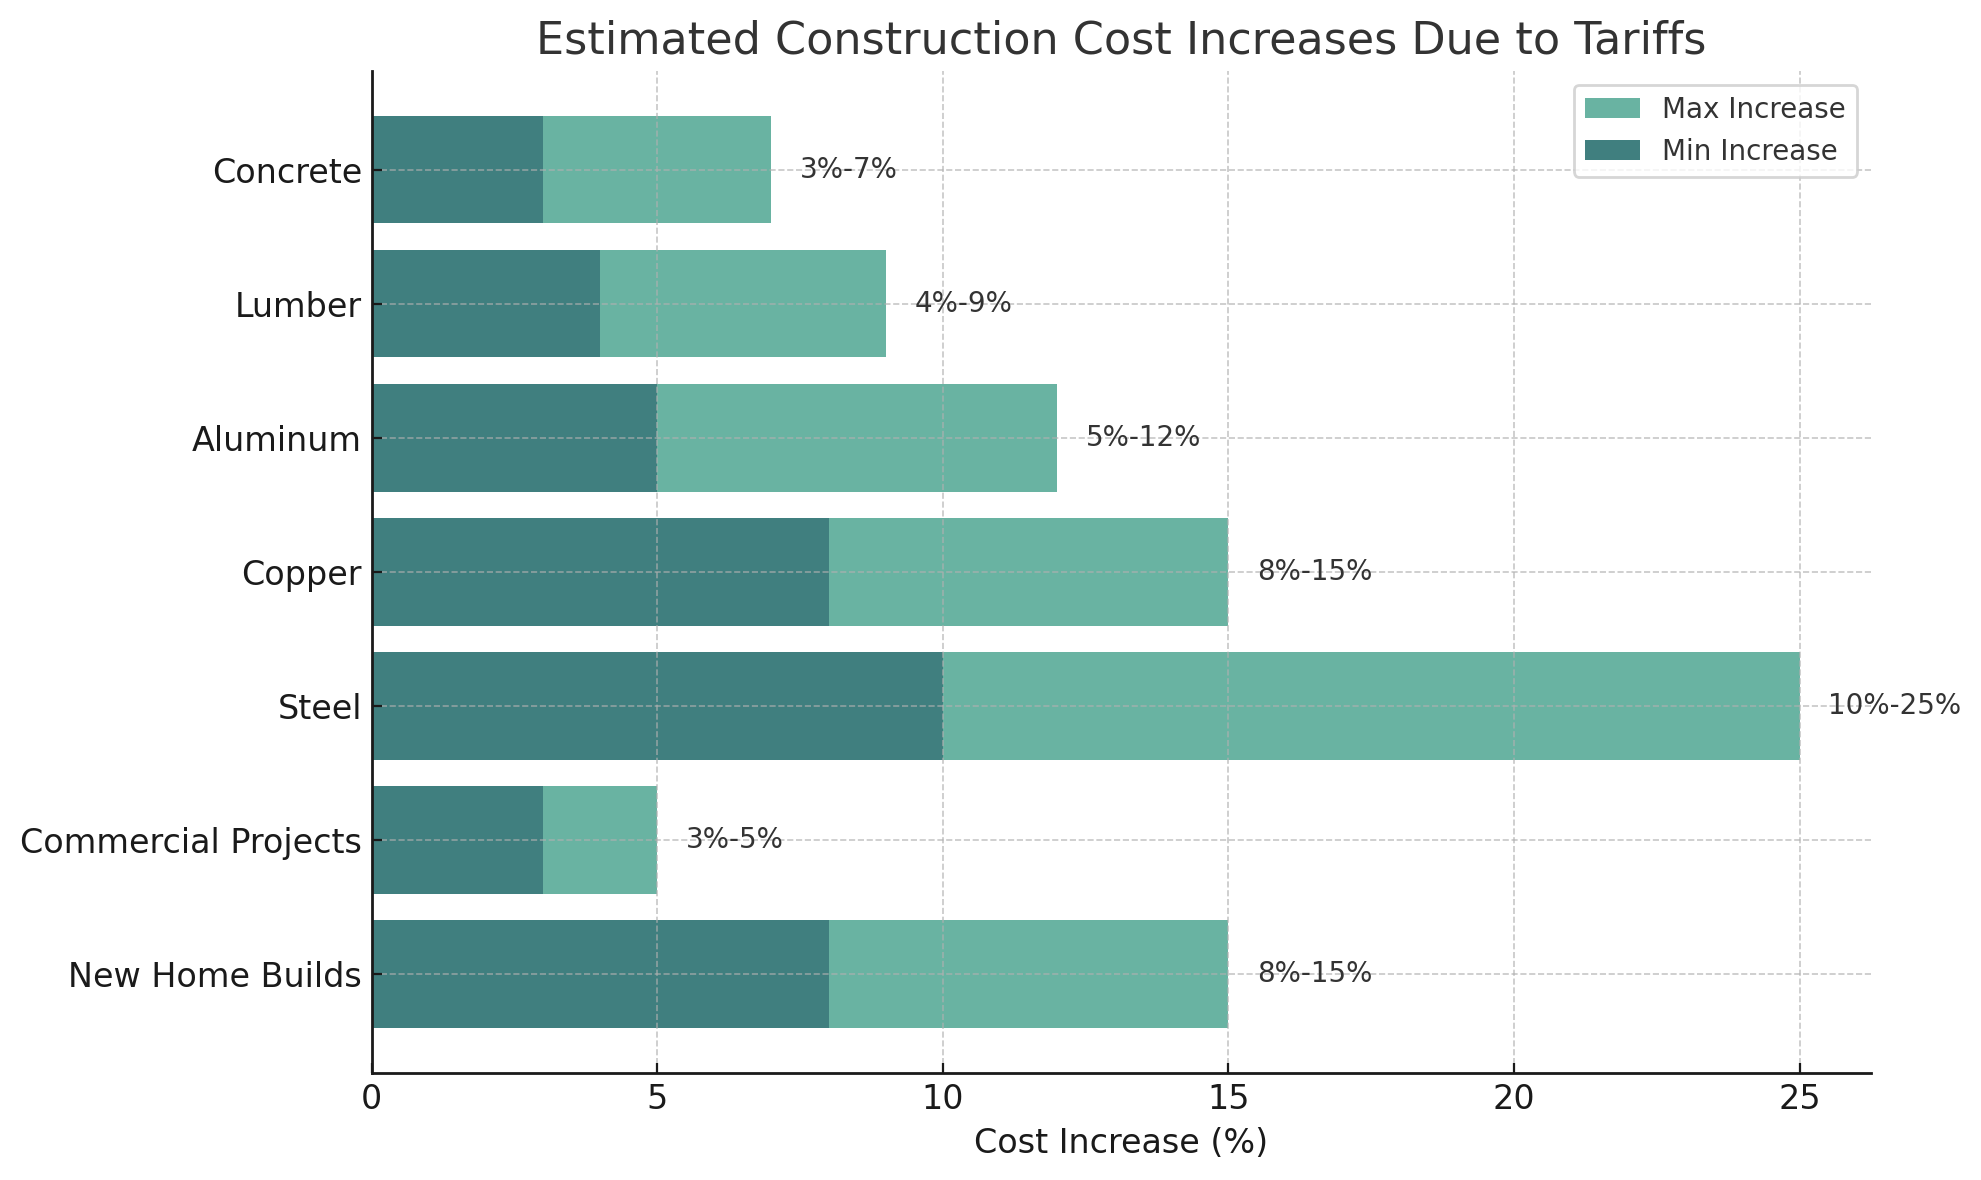
    Construction inputs are rising fast, often faster than end prices can keep pace:

    Construction costs Increase

    Early Signs of Market Impact

    Housing starts are down 14.2% as of March—the lowest in eight months

    Consumer behavior is shifting: 30% of Americans are postponing major purchases, and 25% are canceling them entirely

    Developers are pausing deals or revising models mid-cycle

    Implications for Investors

    If you’re capitalizing on projects in this environment, here are the key considerations:

    1. Re-underwrite Immediately

    Hard costs have shifted significantly. Sponsors who haven’t updated budgets since Q4 2024 are likely underestimating exposure.

    2. Focus on Developer Agility

    Partners with boots-on-the-ground capabilities and control over construction (GC or affiliated build teams) are better positioned to manage volatility.

    3. Mitigate Execution Risk

    Ask about procurement timelines, supplier diversification, and contingency strategies. The cheapest deal may not be the most resilient.

    4. Prioritize Location and Product Resilience

    Markets like Florida, mainly coastal or high-demand pockets, can better absorb pricing shifts due to persistent demand. Product types with service-based revenue or long-term hold strategies may also fare better.

    5. Monitor Policy Movements

    Trade policy is highly political. A change in administration or global relations could reverse or deepen the current impact—stay informed.

    Our View

    At Lana Development, we’re adapting quickly, revisiting budgets, accelerating procurement, and doubling down on local supplier networks. Projects with the proper fundamentals and flexibility still present attractive returns. But in this environment, investor discipline is everything.

    I’d be happy to connect if you’re evaluating real estate allocations or need support with stress-

    testing construction-heavy investments.

    Sources:

    https://www.businessinsider.com/general-contractor-tariffs-have-caused-me-lose-business-2025-4?utm_source=chatgpt.com

    https://www.mpamag.com/us/mortgage-industry/market-updates/trumps-tariffs-could-add-thousands-of-dollars-to-new-home-prices/524826?utm_source=chatgpt.com

    https://www.bisnow.com/national/news/construction-development/cbre-tariffs-could-drive-cre-construction-costs-up-5-put-projects-on-hold-128582?utm_source=chatgpt.com

    https://www.businessinsider.com/tariffs-trump-steel-aluminum-tiles-development-real-estate-construction-2025-3?utm_source=chatgpt.com

    https://www.reuters.com/markets/us/us-single-family-housing-starts-tumble-an-eight-month-low-march-2025-04-17/?utm_source=chatgpt.com

    #RealEstateInvesting #ConstructionCosts #Tariffs #CRE #DevelopmentStrategy #InvestorInsights #RiskManagement #newdevelopment #realestateinvestor

  • How Developer Margin Compression Actually Works — And Why In-House Construction Is the Only Real Defense

    How Developer Margin Compression Actually Works — And Why In-House Construction Is the Only Real Defense

    Every real estate developer is dealing with developer margin compression right now. Interest rates that reprice quarterly. Construction materials 35–40% more expensive than they were in 2020. Labor shortages that turn a five-week framing job into an eight-week framing job. Insurance premiums that keep drifting up. And all of that sits on top of land basis that hasn’t come down.

    If you’re an investor evaluating real estate opportunities in 2026, this is the environment your sponsor is operating in. The question is: who’s better positioned to survive it — and to protect your returns while doing so?

    What developer margin compression actually looks like

    According to the McKinsey Global Institute’s Reinventing Construction research, the average large construction project runs 16% over budget and 20% over schedule. For a developer with tight underwriting, those percentages come directly out of investor equity. For a developer with loose underwriting, they come out of investor and sponsor equity — but only after the sponsor has already collected fees.

    Now stack the environmental pressures on top of that industry baseline. According to CoreLogic’s Construction Cost Index and BLS JOLTS data, non-residential construction inputs are up 35–40% since 2020. There are more than 650,000 unfilled construction jobs in the U.S. Permitting timelines in Florida’s premium coastal submarkets — where we build — run 8 to 18 months. Every one of those factors expands the gap between a proforma’s Day-One assumptions and reality.

    The industry answer to developer margin compression is usually one of three responses:

    1. Cut quality to preserve margin. Bad long-term for buyer demand, resale, and reputation.
    2. Raise prices to preserve margin. Works only until it prices out the target buyer.
    3. Cut yourself a wider fee to preserve your margin while the project’s return profile deteriorates. Not investor-aligned.

    None of these actually solve the problem for the LP.

    The real answer to developer margin compression: eliminate the GC layer

    Most real estate developers are not builders. They find land, raise capital, hire architects, secure permits, and then hand construction to a third-party general contractor. The GC hires subcontractors, manages the site, and delivers the finished product. That structure works fine in a low-inflation environment. In a compression environment, it becomes very expensive.

    Here’s the math a lot of investors don’t see:

    • GC markup: typically 15–20% on top of actual construction cost. On a $12M build, that’s $1.8M–$2.4M.
    • Change orders: average 8–10% of budget on a project of this size. On a $12M build, that’s another $960K–$1.2M.
    • Schedule overrun: the McKinsey 20% average, applied to carrying costs, adds another $200K–$400K depending on financing structure.

    Total unnecessary drag on a $12M build routed through a third-party GC: roughly $3M–$4M.

    That $3M+ is not “developer profit” or “investor return” or “sponsor promote” — it’s simply value the project never realizes because two entities with different incentives were operating on the same project.

    Why Lana operates as its own GC

    Lana Development is a licensed general contractor. We build every project we develop. Our construction team has managed projects valued up to $160 million. There is no third-party markup layer. There is no misalignment between the developer and the builder — because they’re the same team. Cost overruns are managed in real time by the same people underwriting the project’s returns. Change orders are rare and small because the design team and the build team never disagree with each other about scope.

    This is not a theoretical claim. Turquoise Homes on 30A — 66 luxury single-family lots delivered on 30 acres — was executed through the peak of the 2020–2023 cost-inflation window. In-house construction kept cost discipline. The project delivered $30 million in net profit on $7 million of equity in 3 years: a 5.29x equity multiple and 74.2% annualized IRR on invested capital. That result is not luck. It’s what happens when the developer and the builder are the same entity in the exact moment of the cycle when developer margin compression is most acute.

    Five questions every investor should ask about developer margin compression

    Regardless of whether you invest with Lana, if you’re evaluating a real estate opportunity in 2026, insist on answers to these five questions before you commit capital:

    1. Who is your general contractor — and how is their fee structured?
    2. What’s your final-cost-vs-original-proforma track record on the last five projects?
    3. How do you handle cost overruns — and who absorbs them?
    4. What construction reporting will I receive during the build?
    5. Are you co-investing your own capital in this project?

    A sponsor who can answer those five with real specificity has already earned a significant amount of your trust. A sponsor who can’t should not be trusted with your capital in a margin-compression environment.

    The bottom line on developer margin compression

    Developer margin compression is real, and it’s not going away. Developers who outsource construction will feel it, absorb it, and pass it through to their investors. Developers who build in-house will absorb it too — but they’ll absorb far less of it, and their investors will feel almost none of it.

    That structural difference is the single biggest thing to underwrite when you evaluate a real estate sponsor right now.

    Interested in how this plays out in a specific deal? Schedule a 15-minute call with Luis Noronha or review the Coastal Living Collection.