← Lana Development | Projects | Contact

Tag: Housing market

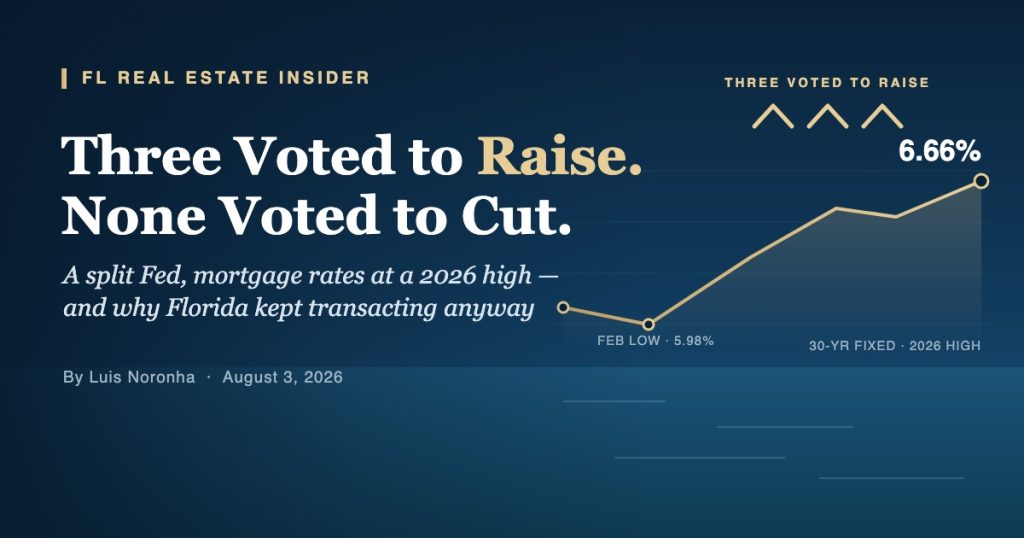
  • The Fed Held Rates Last Week — and Three Officials Voted to Raise Them. Not One Voted to Cut.

    In March, the median FOMC participant projected a lower policy rate by year-end. By June, the median projected a higher one. Last Wednesday three of them formally dissented in favor of hiking. Mortgage rates are higher now than when they voted. If your Florida decision is parked waiting for rate relief, that is your answer.

    FL Real Estate Insider — August 3, 2026
    By Luis Noronha


    On July 29 the FOMC held its target range at 3.50%–3.75%. The vote was 9–3, and all three dissenters — Beth M. Hammack, Neel Kashkari and Lorie K. Logan — “preferred to raise the target range for the federal funds rate by 1/4 percentage point at this meeting.” (Federal Reserve — FOMC statement, July 29, 2026)

    Read that again. Not one official dissented for a cut. Three dissented for a hike.

    None of it should have been a surprise. The document that said so came out on June 17, and I’ve seen almost no coverage of it in this industry.


    Start with the scoreboard, not the forecast

    Here is what Freddie Mac’s 30-year fixed average did across 2026:

    January 15: 6.06%
    February 26: 5.98% — the low of the year
    July 30: 6.66% — the high of the year, and the most recent print

    (Freddie Mac — PMMS; historical archive)

    Seven months into a year I expected to bring relief, the 30-year sits 68 basis points above its February low. Not lower. Higher. And rates are higher now than when the Fed met: Mortgage News Daily’s daily index closed at 6.82% on August 3, up from 6.78% on decision day and within three basis points of its 52-week high. (Mortgage News Daily)

    The number that cuts against me, before you find it yourself: rates are still below where they were a year ago, when the 30-year averaged 6.72%. (Freddie Mac) Rates didn’t explode. The 2026 rally reversed, and the direction of travel for five straight months has been up.


    The Fed’s own projections flipped from a cut to a hike

    Four times a year, FOMC participants publish where they think the federal funds rate should be. Compare two rounds three months apart: the median projection for the end of 2026 was 3.4% in March and 3.8% in June. (Federal Reserve — Summary of Economic Projections, June 17, 2026)

    The midpoint of the current range is roughly 3.6%. So in March, the median participant wanted a cut by year-end. By June, the median wanted a hike. Across the eighteen participants, year-end estimates ran from 3.4% all the way to 4.4%.

    The minutes put the split in the Committee’s own words: “Many participants indicated that the appropriate level of the federal funds rate would be within or slightly below the current target range at the end of this year. Many other participants, however, assessed that the appropriate level of the federal funds rate would be above the current target range at the end of this year.” (June 2026 FOMC minutes)

    What moved them sits in the same document: the median 2026 PCE inflation projection was revised from 2.7% in March to 3.6% in June. (June 2026 SEP) The statement still describes inflation as “elevated relative to the Committee’s 2 percent goal,” against an economy “expanding at a solid pace.” (FOMC statement)

    That is not a committee looking for a reason to cut. The next meeting carrying fresh projections is September 15–16 — and in my experience that lands after most of a Florida year’s contracts are already signed.


    Meanwhile, Florida kept transacting

    In June the state closed 26,036 single-family sales, up 9.3% year over year, at a median of $432,000, up 4.9% — the tenth consecutive month of growth, on 4.5 months of supply. (Florida Realtors, July 17, 2026) Those sales closed into a market where Freddie Mac’s 30-year ran between 6.47% and 6.52% every week of the month. Not 5.5%. Not after a cut.

    Here’s the number I’d put in front of anyone who builds. While demand posted its tenth straight month of growth, new supply was being permitted more slowly: Florida authorized 9,943 single-family units by building permit in June against 10,442 a year earlier — down 4.8% — and 56,060 through the first half against 59,631. (U.S. Census Bureau, series FLBP1FH via FRED)

    Rising absorption into contracting new supply. That happened without a single rate cut.


    The honest counterweight: somebody is paying for that

    Builder sentiment is genuinely weak. The NAHB/Wells Fargo index registered 34 in July, its fifteenth straight month below 40 — and 63% of builders used sales incentives while 37% cut prices outright, averaging 6%. (NAHB, July 2026)

    The incentive I’d watch is the permanent rate buydown, and it is not free. Lennar reported Q1 2026 sales incentives at roughly 14% of sales price, against a historical average of 4% to 6% — and grew new orders 1% year over year anyway, to 18,515 homes. (Lennar — Form 10-Q, quarter ended February 28, 2026)

    Marking this as my view rather than a finding: it works, and it’s a subsidy with a limit, and the limit is whoever’s margin is funding it. The question isn’t who’s offering a buydown — it’s who can fund one for another eighteen months without taking it out of the house. That describes builders selling to financed buyers. It is not a claim that the dynamic has reached the cash tier.


    The buyers who never opened a rate sheet

    This is the part that matters most to the capital this newsletter serves, and I’ll stay on one reference for all of it — sales above $1 million.

    82% of Miami-Dade $1 million-and-up condo sales closed all-cash in 2025, against a national all-price share of roughly 25%. (MIAMI REALTORS®, July 2026) Four in five transactions in that tier of the Miami-Dade condo market never touch a lender. That figure is the condo slice — no matching cash share is published for million-dollar single-family, which was about three-quarters of last quarter’s volume.

    And the tier grew while rates climbed. In the second quarter, $1 million-plus transactions across Miami-Dade, Broward, Palm Beach, the Treasure Coast and Southwest Florida rose 20.1% to 8,013 single-family sales and 23.5% to 2,590 condos. Miami-Dade is not the center of gravity: Southwest Florida leads on volume — 2,880 single-family, 869 condos — and among individual counties Palm Beach leads at 2,534, against Miami-Dade’s 1,000. (Keyes/Illustrated Luxury Market Report, Q2 2026, via RISMedia) In June, Miami-Dade’s million-dollar sales rose 29.14%, from 374 to 483. (MIAMI REALTORS®)

    Two things cut against the easy read of that. The Treasure Coast went the other way — million-dollar single-family sales down 6.5%, condos down 16.9%. And the average luxury condo price rose just 0.3% on that 23.5% volume gain: the same shape the statewide condo tape showed in June — sales up 14% on a median price up 1.7% — now visible at the top of the market too. (Keyes/Illustrated via RISMedia)

    So: consistent with the case I made in June’s Florida Luxury Buyer issue, not proof of it. The 82% is a 2025 reading, and one quarter of volume growth in one region is a data point, not a trend.


    From the Developer’s Seat

    What follows is my opinion, not statute and not data — I want to mark that clearly.

    Waiting has stopped being free: “when rates come down” is not a plan, it’s a leveraged bet on one macro variable that three of the people who set it just voted to move the other way. In the financed tier, the surviving edge is a margin thick enough to fund a buydown for another eighteen months without taking it out of the build; in the tier this newsletter is written for, the edge is an end buyer who never needed the financing at all. Disciplined, developer-led, ground-up Florida new construction sold to that second buyer doesn’t need the Fed to cooperate — it needs the basis to be right, the house to be right, and the sponsor still standing in month nineteen. Rising absorption into contracting new supply is the condition that rewards exactly that, and it showed up this year without a single rate cut. That is why Lana’s underwriting was never a rate-cut bet, and why a split Fed is, for us, a non-event.

    So I’ll put the question to you: are you underwriting your next Florida decision on a rate assumption, or on a basis that works at 6.5% and at 7.5%? I read every reply.

    If you want to see how that shows up in live underwriting — the actual rate assumptions, the actual incentive budget, the actual end-buyer profile — that’s exactly the conversation the Lana Investor Memo is built for.

    → Request access at coastal-living-collection.com (accredited investors only).

    And if you know someone who’s been sitting on a Florida decision waiting for a cut, forward this to them. That’s the person this issue was written for.

    Until next week,
    Luis


    Sources

  • The Florida Luxury Buyer in 2026: Tighter, Wealthier, and More Durable Than the Headlines Suggest

    The “Florida is cooling” story is true for the median household and quietly false for the buyer who actually clears new luxury and move-up product. Here is what the data show — and what they mean for capital.

    FL Real Estate Insider — Week of June 8, 2026 By Luis Noronha


    There are two Florida housing markets right now, and almost every headline you have read this spring is describing only one of them.

    The first market is the one in the headlines: cooling migration, rising inventory, price cuts on the Gulf Coast, a median sale price that slipped 1.3% year over year to about $394,000 in the first quarter. That market is real, and if you own a 2004-vintage condo in an overbuilt corridor, it is the only market you can feel.

    The second market is the one I underwrite for a living — the buyer of well-built, code-current new luxury and move-up product. And in that market, the data is telling a very different story: fewer buyers than five years ago, but the ones who remain are wealthier, less leveraged, and more committed than at any point in recent memory.

    This week I want to lay out what the numbers actually say about the Florida luxury buyer in 2026, where the demand is concentrating, and — clearly marked as opinion at the end — what I think it means for capital deployed into ground-up Florida new construction.


    The migration story is more interesting than “it’s slowing”

    Start with the headline everyone leads with. Florida’s net domestic in-migration fell from 310,892 in 2022 to just 22,517 in 2025 — a roughly 93% collapse over three years, dropping Florida to eighth among the states for state-to-state migration. (Newsweek)

    That number is real. It is also incomplete in two ways that matter enormously if you are selling — or financing — luxury product.

    First, the migration is cooling, not reversing, and the people still arriving are dramatically wealthier than the people leaving. The most recent IRS migration data shows Florida captured a net $20.6 billion in adjusted gross income from interstate migration — nearly four times the gain of second-place Texas at $5.5 billion. The average AGI of a tax filer who moved to Florida from another state was $122,530, the highest of any state in the country, and the households arriving earned on average roughly 60% more than the households that left. (Florida Realtors) Palm Beach County alone posted a net income inflow of $22.7 billion from domestic migration over 2019–2023, ranking it first in the nation. (MIAMI REALTORS)

    Second, the international channel — the one that disproportionately feeds the Florida luxury market — is still running at the top of the country. In 2025 Florida led every state in net international migration, with 178,674 more people arriving from abroad than leaving. (Florida Realtors)

    So the honest read of the migration data is not “Florida is emptying out.” It is “the price-elastic middle-class family buyer is being squeezed out by affordability, while the high-income domestic mover and the international buyer — the two cohorts that actually clear luxury product — are still here.” The demand base is not shrinking so much as it is sorting.


    The luxury buyer is paying cash — which means rates barely touch them

    Here is the single most important fact about the Florida luxury buyer in 2026, and it is the one that explains why this cohort is insulated from the mortgage-rate environment that is punishing everyone else: at the top of the market, this is a cash market.

    At the top of the Miami-Dade condo market, 82% of $1 million-and-up sales closed all-cash in 2025 — against a national all-price share of about 25%. Four in five transactions in that tier never touch a lender. And the cash share runs deep below the luxury tier too: in June 2026, cash accounted for 38.1% of all Miami-Dade closed sales, 48.5% of existing condo sales, and 27.6% of single-family transactions. (MIAMI REALTORS®)

    When the buyer pays cash, a 7% mortgage rate is not a gate — it is a footnote. As one Palm Beach market read put it, in the high-end segment liquidity, not leverage, is setting the pace. (MILLION) That is exactly why the luxury tape and the broad tape have decoupled this cycle. The rate-sensitive buyer paused; the cash buyer did not.

    And the cash buyer kept buying. Closed sales of single-family homes priced above $1 million rose 15.2% year over year in April 2026 statewide. (letsmovetofla) In Miami, $1 million-plus single-family sales jumped 21.34% year over year, from 164 to 199 transactions. (Haute Residence) At the very top, sales above $10 million stayed historically active — 262 transactions in the first nine months of 2025, on pace for roughly 426 by year-end, close to the 2021 record. (MILLION)


    The supply picture is split down the same line as the demand picture

    This is where the two-markets framing becomes impossible to miss. Look at months of supply — the cleanest measure of who has pricing power.

    Statewide in June 2026, Florida single-family inventory stood at a 4.5-month supply while condo and townhouse inventory sat at 8.1 months — nearly double, in the same state, in the same month. (Florida Realtors) In Southeast Florida the gap is wider and more durable: the MIAMI REALTORS® outlook projects single-family months’ supply tightening from 5.7 at end-2025 to 4.9 at end-2026 and 4.2 at end-2027, while condo supply eases only from 12.9 to 11.6 to 9.6 — more than double the single-family figure at every point in the forecast, with the overhang concentrated in exactly the aging, pre-code, assessment-burdened stock I wrote about in The Condo Cliff. (MILLION)

    That is the whole story in two numbers. The well-built single-family and new-construction product the luxury buyer wants is getting scarcer. The older condo stock that buyer does not want is getting more abundant. Same state, same month, opposite markets.


    The wealth being created is structural, not a sugar high

    It would be easy to dismiss all of this as a post-pandemic hangover that fades. The wealth data says otherwise.

    Knight Frank’s 2026 Wealth Report — its twentieth edition — counts the global population of ultra-high-net-worth individuals (those worth more than $30 million) rising from 551,435 in 2021 to 713,626 in 2026: roughly 89 people crossing the $30 million threshold every single day. The United States created 41% of all the new UHNWIs in that period, lifting its share of global ultra-wealth from 33% to 35%. And 22% of UHNWIs plan to buy a luxury home this year. (Knight Frank, Think Global People)

    Florida sits directly in the path of that capital. Miami-Dade alone added 50% more millionaires over the past decade. (Family Wealth Report) The buyer pool for Florida luxury is not a pandemic artifact that reverts. It is being replenished, structurally, faster than the state can build product for it.


    From the Developer’s Seat

    What follows is my view, not statute or data — I want to mark that clearly.

    Here is what I take from all of this. The dominant 2026 narrative — affordability cliff, migration reversal, a cooling market — is accurate for the median Florida household and increasingly misleading for the buyer of code-current new luxury and move-up product. Those are two different markets, and the data has pulled them apart this cycle more cleanly than I have seen in fifteen years.

    The buyer who clears the kind of product I build is, today, more durable than at any point in the last five years: wealthier on arrival, paying cash, insulated from rates, drawn by lifestyle rather than a job relocation that can be reversed by a return-to-office memo, and being replaced from a global wealth pool that is growing by the day. Fewer total buyers — but the remaining ones are exactly the buyers a disciplined developer wants, and they are competing over a single-family and new-construction supply that is getting tighter, not looser.

    For an HNWI or family-office investor, the strategic point is this: the slowdown everyone is reading as a reason for caution is, in the luxury and move-up lane, a sorting mechanism that is concentrating demand into precisely the product code-current ground-up new construction produces. Backing a developer who builds for that durable end buyer is not a bet against the Florida cooling — it is a bet on which side of the cooling you are standing on.

    If you want to see how this buyer-durability framework applies to the live Lana pipeline — the specific corridors, the specific end-buyer profile, and the underwriting behind it — that is exactly the conversation the Lana Investor Memo is built for.

    → Request access at coastal-living-collection.com (accredited investors only).

    Until next week, Luis

    P.S. — Accredited investor? The Lana Investor Memo and the live pipeline behind this week’s thesis live here: coastal-living-collection.com.


    Sources


  • Wall Street Isn’t Raising Your Rent. It’s Keeping You a Renter.

    117,000 Florida homes, a 35% share of eviction filings, and a $48 million FTC settlement — what the institutional partition of Florida single-family actually means

    FL Real Estate Insider — May 2026 Issue
    By Luis Noronha


    Drive through almost any new-built subdivision between Lakeland and DeLand and play a game: count the houses with the same beige paint, the same xeriscaped yard, the same blank-eyed front door. The ones where you can’t quite tell who lives there. Pull up the property appraiser. Most of those deeds don’t have a person on them. They have an LLC with a name like SWAY 2014 BORROWER LLC or JEFF 1 LLC — and that LLC rolls up to one of a handful of companies headquartered nowhere near Florida. (Tampa Bay Times — Buying up the Bay)

    The story that institutional landlords are jacking up your rent is the easy one to tell. The Florida data tells a different one — and it’s a bigger problem for the Florida that homeowners thought they were buying into.


    117,000 Florida homes — and who actually owns them

    The Tampa Bay Times’ year-long Buying up the Bay investigation, the first state-level analysis of its kind, found that corporate real estate investors now own more than 117,000 single-family homes across Florida. (Tampa Bay Times, Florida Trend)

    The concentration is sharper at the metro level than the statewide number suggests:

    • In Pinellas and Hillsborough counties combined, the top 10 corporate investors control roughly one in five single-family rentals. (Tampa Bay Times)
    • The five largest corporate landlords in the Tampa Bay region together own about 20,000 single-family homes. (Tampa Bay Times)
    • The Government Accountability Office’s March 2026 report puts institutional ownership at 15% of the Tampa metro single-family rental market, and an Urban Institute analysis found Tampa with roughly 23,000 institutional-owned homes. (GAO-26-108675, Urban Institute)
    • Jacksonville is the most concentrated metro in Florida — 21–22% of single-family rentals owned by institutional investors per the GAO; the Urban Institute’s earlier estimate ran higher, at 24.2%. (GAO-26-108675, Urban Institute)

    If you operate in any of those metros, the often-quoted “institutional investors only own 2% of US rentals” talking point is irrelevant. (GAO-24-106643) The local concentration is what matters, not the national average.


    What the data actually says about rents

    The conventional populist line is that corporate landlords are coordinating rent hikes and pricing Floridians out of housing. The available evidence does not support that framing as cleanly as it gets repeated.

    What the Tampa Bay Times found, after analyzing tax-parcel records, eviction dockets, and tenant interviews across the region, was that the outsized impact of a handful of companies “can squeeze individual buyers out of the housing market.” (Tampa Bay Times) Not push rents up — push buyers out. That is a different problem, and a more durable one. Every Tampa Bay home that converts from owner-occupied to corporate-rental is a home that will not return to the homeowner inventory in the foreseeable future. Multiply that by 117,000 statewide.

    The University of Florida Shimberg Center’s 2025 Rental Market Study puts the human cost in plain numbers: roughly 905,000 low-income Florida renter households are now cost-burdened, paying more than 40% of their income toward rent. (Shimberg Center) That is the audience that will not be buying in 2026, 2027, or 2028 — and the corporate-rental conversion is one reason why.


    Where the eviction story lives

    If there is a single statistic that should change how Florida thinks about institutional landlords, it is this one. The Tampa Bay Times tracked 2023 eviction filings in Pinellas and Hillsborough by the 10 largest corporate landlords in the region and found those companies accounted for 35% of all single-family rental eviction filings — nearly double their share of the rental homes. (Tampa Bay Times)

    That is not a marginal effect. Invitation Homes alone filed at least 250 eviction cases in Hillsborough County in 2023. (Tampa Bay Times) Princeton’s Eviction Lab, cited in the same reporting, found that large landlords nationally are two to three times more likely to evict than small landlords. (Tampa Bay Times)

    The institutional model relies on rapid eviction-and-re-lease as the response to delinquency. That is a design choice, and it is the mechanism that converts a housing shortage into a churn business.


    The FTC settlement that confirmed the playbook

    In September 2024 the Federal Trade Commission sued Invitation Homes — by far the largest single-family landlord operating in Florida — for a long list of alleged unfair and deceptive practices. The case settled for $48 million. The FTC’s allegations are worth reading in their own right:

    • Advertised monthly rental rates that excluded mandatory junk fees totaling more than $1,700 per year per household.
    • Promised “pre-inspected” homes and “24/7 emergency maintenance” while new residents reported sewage backups, broken appliances, and visible rodent feces.
    • Withheld security deposit funds for normal wear-and-tear and pre-existing damage; pursued eviction proceedings against tenants who had already moved out.

    (Federal Trade Commission, September 24, 2024)

    The FTC began mailing $47.2 million in refund checks to harmed consumers in March 2026. (Federal Trade Commission)

    The point is not that every institutional landlord operates this way. The point is that the largest one in Florida, by the federal regulator’s own findings, did — and the practices the FTC documented are exactly the practices that turn the corporate-rental model into the homeownership-displacement story above.


    What the partition means — and what it doesn’t

    Here is where I think most of the commentary on this goes wrong, in both directions.

    The funds did not buy Florida. They bought a very specific slice of it. Institutional buy-boxes are tight and public: typically 1,500–2,200 square feet, three-bed/two-bath, post-2000 construction, in the same handful of ZIP codes across the I-4 corridor and Duval County. They do not touch 1970s ranches, flag lots, septic, or anything that needs a decision a spreadsheet can’t make. And they are almost entirely absent from the price tiers where the end buyer pays cash.

    So the partition is real, and it is narrow. In the metros and product types the funds targeted, they are dominant — and where they are dominant, the homeownership rate falls and the renter share rises. That is the real cost. Not a few extra dollars on rent, but a generation of Floridians who got priced out of the deed and into the lease, paying junk fees on a home they will never own.


    What this means for our lane

    I want to mark what follows as my view, not reporting.

    Three things follow from the partition, and none of them is “go compete with Invitation Homes.”

    First, the regulatory wind is turning against investor-held inventory, not toward it. Every live property tax proposal that came out of the 2026 Florida session concentrates its benefit on homesteaded, owner-occupied primary residences and explicitly excludes second homes, short-term rentals, and institutional single-family-rental portfolios. The 10% non-homestead assessment cap keeps the rules less favorable for investor-held stock, with a reset to full market value on transfer. The eviction data and the FTC settlement are exactly the kind of record that makes that political anchor harder to move, not easier. Whoever is positioned to sell to an owner-occupier in Florida is on the right side of that.

    Second, the institutional bid and the HNWI move-up buyer are not competing for the same house. A fund underwriting a 1,800-square-foot merchant-build rental at an algorithmic price ceiling is not bidding against a cash buyer choosing a code-current primary residence in a coastal corridor. That matters for basis: the segment of Florida single-family that has an institutional floor under it is not the segment ground-up new construction for the HNWI end buyer is delivering into. The two markets look adjacent on a MLS map and behave nothing alike.

    Third, the displacement has to land somewhere. A generation being pushed out of the entry-level deed does not create demand for luxury new construction — I want to be honest about that rather than pretend the connection is direct. What it does create is a Florida where the owner-occupied primary residence becomes politically and fiscally privileged, where the entry tier is increasingly a rental product owned by someone else, and where the durable homeownership demand concentrates at the tiers that can still clear without financing. That is a slow, structural sort — and it runs in the same direction as everything else I have written about this year.


    What to watch

    The Tampa Bay Times also documented a separate Florida-specific problem in late 2024: a state law that has allowed corporate buyers to terminate condo associations and force out individual unit owners through bulk-purchase mechanisms. (Tampa Bay Times) Expect this to be a 2027 legislative fight, and note where it points: at the same aging condo stock already under SIRS and milestone pressure.

    The FTC settlement is also unlikely to be the last federal action. Single-family rental operators are now an active enforcement target across multiple agencies.


    From the Developer’s Seat

    This section is my view, not data.

    I get asked periodically why Lana does not run a Florida single-family rental strategy, given how much attention the segment gets. The honest answer is that the institutional partition is precisely the argument against it. In the metros where the buy-box is dense, we would be bidding against balance sheets that can pay an algorithmic ceiling and hold indefinitely. In the metros where it is thin, the yield is thin for the same reasons the funds skipped it. Neither is an edge.

    The edge is on the other side of the partition entirely: code-current, developer-led, ground-up product sold to an owner-occupier who pays cash — a buyer the funds do not compete for, in a tenure category the state’s own tax policy is actively privileging, at a price tier where the rate environment is a footnote rather than a gate. Every structural force in this issue points at that buyer: the political tilt toward homestead, the regulatory heat on institutional rental, the hollowing of the entry-level deed.

    That is the lane Lana Development builds in — Galleria Villages, Turquoise Homes, Waterview, West Bay. It is also the lane in which patient family-office and HNWI capital has a structural advantage over institutional capital, because the holding period, the buyer profile, and the underwriting risk are all things private capital handles better than a public vehicle answering to a quarterly cycle.

    If you are an accredited investor and want to see how that shows up in live underwriting — the actual end-buyer profile, the actual basis, the actual corridors — that is exactly the conversation the Lana Investor Memo is built for.

    → Request access at coastal-living-collection.com (accredited investors only).

    Luis


    FL Real Estate Insider exists to cover the parts of Florida real estate that get glossed over in the brokerage marketing emails. If this helped, forward it to someone who needs to read it.


    Sources

  • The Condo Cliff: Florida’s Post-Surfside Reform Was Right. The Implementation Is Breaking Owners.

    Florida’s Post-Surfside Reform Was Right. The Implementation Is Breaking Owners.

    FL Real Estate Insider
    By Luis Noronha


    On June 24, 2021, at roughly 1:22 a.m., Champlain Towers South — a 12-story beachfront condominium in Surfside, Florida — partially collapsed. Ninety-eight people died.

    The forensic record is now public. Long-term concrete degradation in the basement-level parking garage and pool deck, water penetration, corrosion of reinforcing steel. Structural concerns had been documented as far back as 2018 and described as “much worse” in April 2021. A roughly $15 million remediation program had been approved by the association before the collapse — but the main structural work hadn’t started.

    Four years later, the legislative response to that night is reshaping Florida’s older condominium market in ways most owners are only beginning to feel. The reforms were necessary. The transition is painful. And it’s worth being honest about both.


    What the law actually requires

    Florida’s response came in two pieces of legislation: SB 4-D in 2022 and SB 154 in 2023, which together rewrote Chapter 718 of the Florida Statutes (the Condominium Act) on three fronts. The framework applies to residential condominium and cooperative buildings three stories or more in height.

    1. Milestone Inspections. Every covered building must undergo a milestone structural inspection by December 31 of the year it reaches 30 years of age (measured from the certificate of occupancy), and every 10 years after that. Buildings that had already passed 30 years before July 1, 2022 were required to complete their initial inspection by December 31, 2024. Phase 1 is a visual structural inspection by a licensed architect or engineer; Phase 2 follows if Phase 1 identifies substantial structural deterioration.

    2. Structural Integrity Reserve Studies (SIRS). Associations must commission a SIRS that identifies key structural and waterproofing components, estimates remaining useful life and replacement cost, and provides a funding schedule. Per the current statutory framework, the SIRS must be completed by December 31, 2026. An association required to perform a milestone inspection by that same date may complete the two simultaneously.

    3. Mandatory reserve funding. This is the one with the largest financial impact. For budgets adopted on or after December 31, 2024, funding of SIRS reserves can no longer be waived or reduced by a unit-owner vote. Florida boards had legally been able to underfund or skip these reserves for decades, keeping monthly fees lower than the actual cost of building maintenance. That option is now closed for SIRS components. (A narrow temporary waiver of up to two years exists while repairs are actively being completed, requires a full membership vote, and cannot extend beyond 2028.)

    The statutory home for all of this is § 718.112, Florida Statutes, with the milestone inspection framework primarily in § 553.899.


    Why this hits older buildings hardest

    The economic logic isn’t complicated. For decades, a meaningful number of Florida condo associations — particularly in older coastal buildings — adopted budgets that did not fully fund reserves for major structural components. Members voted year after year to waive or reduce them. That kept monthly fees artificially low and made it easier to sell units, but it deferred maintenance bills onto a future the association did not budget for.

    The law has now ended that deferral. The bills are coming due in two forms simultaneously:

    • Higher recurring fees — because reserves now have to be fully funded going forward.
    • Special assessments — because the SIRS will, in many older buildings, identify substantial work that should have been funded years ago.

    Specific dollar figures will vary enormously by building, age, location, structural condition, and prior reserve discipline. Anyone quoting you a single “average” number is guessing. What is documented is the direction: in buildings that deferred maintenance for decades, the catch-up is real, and it is being paid by current owners.


    The unintended consequence (this is opinion)

    I want to clearly mark what follows as my view, not statute.

    A meaningful share of older Florida condo units — especially in coastal, lower-rise buildings — are owned by long-time residents who paid off their mortgages years or decades ago. These owners are often equity-rich and cash-poor: they own a home outright but live on fixed incomes, may not qualify for new financing against an aging structure, and don’t have the runway to wait out a multi-year capital program.

    When the assessment letter arrives, some of them can absorb it. Many can’t. Those who can’t are facing a forced choice between a loan they can’t get, a HELOC the bank may not write, or a sale at whatever price the market will currently pay for a building that just publicly disclosed major structural work.

    I’ll say plainly what I think is happening: a wealth transfer is taking place, from older long-tenured owners who deferred reserves under rules the state previously allowed, to cash buyers and entities equipped to underwrite the post-SIRS economics. I don’t think anyone designed this outcome. I think it is the predictable consequence of letting reserve waivers run for forty years and then ending them all at once.

    The legislative response was right. The transition is being managed thinly. Both can be true.


    What I’d tell different people right now

    These are recommendations from a developer’s perspective. None of this is legal, financial, or tax advice — get qualified professionals before you act.

    If you own in a covered building: Read the milestone inspection report and SIRS in full. Don’t accept a one-page summary. Push your board for the longest legally permissible timeline on capital projects and assessments. If you are considering selling, understand that disclosure obligations grow as reports are issued — selling earlier in the process is materially different from selling later. And get a real estate attorney before you sign anything, particularly if a buyer is offering a fast, all-cash close on a building that just received its SIRS.

    If you serve on a board: The personal liability exposure for boards under the new framework is real. Document everything. Get the inspection and SIRS done by qualified, licensed professionals — not the cheapest bidder. Communicate openly with owners; the worst outcomes I’ve seen so far have come from boards that tried to soften the message and lost their owners’ trust in the process.

    If you’re a buyer with cash: Older buildings are not all equal. A well-managed building that has already completed its milestone inspection and SIRS, has a credible capital plan, and has begun executing it is a fundamentally different asset than a building still in the disclosure pipeline. Underwrite the building, not the unit.

    If you’re a legislator: The reform is sound. The transition deserves more attention. Bridge financing, deferred-payment programs tied to age and income, or property tax mechanisms that smooth the assessment burden over time would honor the safety intent of the law without disproportionately punishing the cohort least able to absorb the cost. We have time to do this. We are choosing not to.


    What’s coming next

    The reform is now in active execution. Initial milestone inspections for the oldest buildings were due by December 31, 2024. SIRS work has to be complete across covered buildings by December 31, 2026. The reserve funding rules apply to budgets adopted on or after December 31, 2024 — meaning fiscal year 2026 is the first full cycle in which most associations are operating under the new regime.

    Translation: we are at the front of this story, not the back of it. More inspection reports, more reserve studies, more budget letters, and more assessment notices are coming over the next 18 to 24 months.

    If you or someone you care about owns in an older Florida condo and your board is being vague about milestone or SIRS timing, that vagueness is the story. Get the documents. Read them carefully. Get advice from people who are paid to be on your side.


    This newsletter exists to cover the parts of Florida real estate that get glossed over in the brokerage marketing emails. If this was useful, forward it to someone who needs to read it.

    — Luis


    P.S. If you’re trying to navigate a milestone inspection, a SIRS, or a special assessment and you’re not sure where to start, hit reply. I’m happy to point you to a qualified attorney, structural engineer, or broker. No pitch attached.


    Sources

  • Housing Market Predictions 2025–2029

    Housing Market Predictions

    Housing Market Predictions for Next 5 Years: 2025 to 2029

    The U.S. housing market stands at a pivotal juncture, shaped by a shifting economic landscape, evolving demographics, and technological disruption. With rising interest rates, changing consumer behavior, and a highly dynamic global context, the market outlook for the next five years—from 2025 to 2029—demands deep analysis and precise forecasting. For real estate developers, investors, and housing policy experts, understanding these dynamics will be critical to capitalizing on opportunities and mitigating risks in residential real estate.

    In this post, we explore expert-driven forecasts on home price trends, geographic growth hotspots, demographic influences, rental market trajectories, and risk factors that are likely to influence the U.S. housing market’s evolution through 2029.

    Home Price Trends and Regional Variations

    After a decade of largely bullish trends in housing prices—punctuated briefly by the market corrections of the early 2020s—the next five years are expected to see more nuanced, regionally diverse growth patterns. According to projections by Fannie Mae and the National Association of Realtors, national home price appreciation will moderate to an annual average of 2.5% to 4%, far below the feverish double-digit growth of 2020-2021.

    However, this cooling will not uniformly affect all markets. Sun Belt cities such as Austin, Phoenix, and Tampa, which experienced explosive growth in the 2020s, may face continued price volatility due to affordability issues and overbuilding. In contrast, mid-size metros in the Midwest—think Columbus, Indianapolis, and Minneapolis—are forecast to emerge as more stable markets with steady year-over-year price growth and increased institutional investment interest.

    Housing affordability will also remain an enduring concern. High mortgage rates—projected to hover between 5.5% and 6.5% through 2029—combined with constrained new housing supply in desirable urban and suburban areas, are likely to keep price-to-income ratios well above historical norms. Market analysts predict a sustained inventory shortage, mainly affecting entry-level homes, which may hinder demand despite buyers’ intent.

    Demographic Drivers and Demand Shifts

    From 2025 through 2029, demographic patterns will exert a powerful influence on both housing demand and design. The maturation of Millennial and early Gen Z cohorts into their peak homebuying years promises a significant baseline of demand. Millennials, many of whom postponed homeownership due to student debt and economic instability, will likely drive the market for both single-family homes and urban condos—especially in lifestyle-centric, affordability-advantaged metros.

    Concurrently, Baby Boomers are downsizing at record levels, reshaping inventory flows and property types coming to market. This generational shift opens avenues for developers focusing on active adult and mixed-use communities tailored for aging residents. Expect a growing demand for aging-in-place features, energy efficiency, and smart home technologies in newly built homes targeting older, mobile populations.

    Meanwhile, immigration policy will play a wildcard role. Should immigration rates recover post-2025 due to policy changes or labor market needs, the influx of new residents can buoy demand in both urban rental markets and first-time buyer segments.

    Rental Market Projections and Multifamily Developments

    The rental housing market, after undergoing significant volatility during the COVID-19 era, is projected to strengthen in the second half of the 2020s. Rising interest rates will push more younger consumers into renting for longer durations. Urban centers offering high-wage job clusters, such as Boston, Seattle, and Denver, are expected to see increased renter demand that outpaces residential construction starts, leading to upward pressure on rents.

    According to the Urban Land Institute, multifamily development will remain a top investment arena for institutional investors, increasingly focused on environmentally certified, tech-enabled, and transit-accessible properties. Suburban build-to-rent (BTR) communities—a hybrid between single-family homes and traditional multifamily—are poised for rapid expansion, serving middle-income households priced out of ownership yet seeking space and amenities.

    Land use reform and zoning changes at the municipal level could further accelerate multifamily construction. Cities such as Minneapolis, Portland, and Charlotte have already begun implementing reforms to permit higher-density projects in traditionally single-family zones, paving the way for new development pipelines that align with changing societal norms and sustainability imperatives.

    Technological Disruption and Infrastructure Development

    Technology will continue to reshape the housing development landscape between 2025 and 2029. Proptech innovations—including AI-driven valuation tools, blockchain-enabled property transactions, and digital twin modeling—will enhance project viability analyses, streamline sales, and reduce costs. Automation in construction, like 3D-printed housing components and modular prefabrication, will play pivotal roles in addressing labor shortages and affording faster project timelines.

    Broadband expansion and remote work adoption will also shift geographical demand. Second-tier and “Zoom Town” markets—such as Bozeman, Chattanooga, and Spokane—will thrive as viable alternatives for professionals seeking lifestyle affordability without sacrificing connectivity or amenities. Infrastructure investments authorized under the 2021 Infrastructure Investment and Jobs Act will further catalyze residential development in previously underutilized growth corridors, especially near new transit lines or logistics hubs.

    Key Risks and Market Uncertainties

    No housing market forecast is complete without considering downside scenarios. The most salient risks facing the housing market through 2029 include:

    • Interest Rate Volatility: The possibility of higher-than-expected inflation or sustained monetary tightening could lead to prolonged periods of elevated borrowing costs, reducing affordability and slowing transaction volumes.
    • Geopolitical Disruptions: Global instability—whether from armed conflicts, climate-related migration shocks, or commodity price instability—could reverberate through capital markets and affect construction costs and buyer sentiment.
    • Regulatory Constraints: Housing development continues to be heavily localized, subject to zoning, permitting, and NIMBY opposition. Delayed entitlements, litigation, and construction hurdles will challenge timeline and cost structures, particularly in high-demand urban cores.
    • Climate Risk: Increasingly, climate change is shaping both insurance pricing and development feasibility. Markets vulnerable to hurricanes, wildfires, or water scarcity (e.g., Florida, California, Arizona) may see declining investor appetite, while “climate-resilient” cities could ascend in strategic prominence.

    Investment Opportunities for Developers and Stakeholders

    Despite a moderated growth landscape, opportunities abound for stakeholders who align their strategies with demographic realities, technological shifts, and local policy trends. Key investment themes anticipated between 2025 and 2029 include:

    • Attainable Housing: Developing mid-tier homes with efficient footprints, shared amenities, and affordability incentives will address acute shortages and appeal to underserved segments.
    • Mixed-Use Communities: Projects that integrate housing with retail, wellness, and co-working spaces will thrive in both post-pandemic urban design and aging-in-place scenarios.
    • Green and Healthy Buildings: ESG-focused investors are increasingly demanding carbon-neutral construction, indoor air quality optimization, and renewable energy integration—all poised to become development hygiene factors rather than differentiators.
    • Adaptive Reuse: Converting underutilized commercial stock (office buildings, malls, warehouses) into housing offers lower acquisition costs and aligns with sustainability goals and municipal revitalization programs.

    Conclusion: Navigating a Balanced Yet Dynamic Market

    The next five years in the U.S. housing market will present a more measured pace of growth than the frenetic peaks and valleys of the early 2020s. For real estate professionals, success will hinge on carefully navigating macroeconomic forces, embracing innovative technology, and anticipating shifting consumer preferences. Geographic and strategic differentiation will become increasingly essential as uniform national trends give way to localized cycles based on infrastructure, policy, and climate profile.

    Ultimately, the housing market from 2025 to 2029 promises fewer windfalls, but greater resilience—where those who prioritize long-view planning, sustainability, and adaptability will emerge as the sector’s next-generation leaders.

    External Sources