← Lana Development | Projects | Contact

Blog

  • Florida Has Become the Epicenter of Construction Labor Enforcement. The Builders Who Survive Are Not Who You Think.

    Florida Has Become the Epicenter of Construction Labor Enforcement. The Builders Who Survive Are Not Who You Think.

    Florida construction labor enforcement under SB 1718 — unfinished frame and idle crane, 10× ICE audit pace

    Three years of SB 1718, a 10-to-1 lead in 287(g) partnerships, and an ICE Notice-of-Inspection rate running ten times the 2024 pace are not punishing every Florida builder equally — they are quietly finishing what the rate cycle started.

    FL Real Estate Insider — Week of June 1, 2026 By Luis Noronha


    There is a number that should be the lead in every Florida real estate publication this June and is in almost none of them: as of June 11, 2025, Florida — three years into SB 1718 — had 295 active or pending 287(g) memorandums of agreement with ICE — more than three times the 95 in Texas and nearly nine times the 33 in Georgia. (Roofing Contractor — Florida Emerges as the Epicenter of ICE Raids)

    That is not a marginal data point. That is the formal infrastructure of a worksite-enforcement regime that has, over the past fifteen months, made Florida the single most active state in the country for construction-site immigration action — by a margin of at least 10-to-1 compared to the next-closest state. (Roofing Contractor — Florida Emerges as the Epicenter of ICE Raids)

    I want to lay out what the enforcement data actually shows, what the labor data actually says about Florida residential construction, who in the builder ecosystem absorbs the shock and who does not, and — clearly marked as opinion at the end — what I think it means for capital deployed into ground-up Florida new construction over the next 24 months.

    This piece is a direct continuation of the May 25 issue (Florida New Construction Is Down 31%. The Builders Who Survived Are Not Who You Think.). Last week I argued that the cost-of-capital wedge between the national publics and the mid-market private builder cohort is the single most under-appreciated story in Florida residential right now. The labor data published since then makes the same argument from the input-cost side. Read together, they tell a coherent story most coverage is still missing.


    What the SB 1718 enforcement infrastructure actually looks like

    The legal and operational machinery has three layers and all three matter.

    Layer one — the statute. Governor DeSantis signed Senate Bill 1718 into law on May 10, 2023. The E-Verify requirement for private employers with 25 or more employees took effect July 1, 2023. The enforcement window — fines of $1,000 per day plus suspension of state-issued licenses for employers who fail to comply three times in any 24-month period — became operative July 1, 2024. (Greenberg Traurig — E-Verify: Florida Senate Passes Bill Requiring State Employers With 25 or More Employees to Use Platform Effective July 1, Bilzin Sumberg — Florida Law Imposes Additional E-Verify Requirements for Private Employers, Florida Senate — SB 1718 (2023) Enrolled Text)

    Layer two — the federal operations. ICE’s rate of Notices of Inspection — the audit instrument that drives the bulk of worksite enforcement — ran in the first half of 2025 at least ten times the 2024 rate, with that pace expected to continue or accelerate through 2026 as funding expands and federal data-sharing agreements (including the recent IRS arrangement) come online. (American Immigration Council — Understanding ICE Raids at American Workplaces (October 2025 fact sheet))

    Layer three — the named operations in Florida. The pattern is no longer theoretical. ICE Tampa’s Operation Tidal Wave in late May 2025 resulted in 1,120 arrests of removable individuals — the largest joint immigration operation in Florida history, per ICE. (ICE — ICE Tampa Conducts Worksite Enforcement at Rapidly Expanding Community, Arrests 33 Illegal Aliens) On May 29, 2025, ICE raided the FSU College Town construction site in Tallahassee and detained more than 100 workers in a single action. (Florida Phoenix — ICE Raids FSU College Town Construction Site, Buses Away Workers)

    The three layers compound. The statute creates the compliance obligation, the federal audit cycle creates the documentation pressure, and the named operations create the day-to-day fear that disrupts crews independent of any individual worker’s status.


    What the labor data actually says

    The industry-level numbers are large and they are not improving.

    The Associated Builders and Contractors estimates the U.S. construction industry must attract roughly 349,000 net new workers in 2026 just to meet demand, with that figure projected to rise to 456,000 in 2027 — a structural gap, not a cyclical one. (Construction Owners — Construction Workforce Crisis Deepens in 2026 Amid Labor Shortages and ICE Raids)

    Recent industry-survey work shows 28% of construction firms experienced workforce disruption tied to ICE enforcement in the past six months, approximately 10% lost workers directly to enforcement actions or rumors of raids, and another 20% reported that their subcontractors had lost workers. (Construction Owners — Construction Workforce Crisis Deepens in 2026)

    The structural exposure is concentrated where Florida residential construction actually happens. Immigrants comprise approximately 34% of all U.S. construction workers, with shares above 60% in drywall, roofing, and plastering trades, and in Florida specifically the share approaches or exceeds 40% across the residential build cycle. (Construction Owners — Construction Workforce Crisis Deepens in 2026, Construction Dive — ICE Raids on Building Sites Stoke Fear, Uncertainty)

    Independent economic analysis estimates the Florida labor shortage alone could push the state’s GDP down by roughly $12.6 billion in a single year — about 1.1% of the state economy. (Bloomberg Línea — Which Sectors Are More Exposed to Florida’s New SB 1718 Laws?)

    The honest read is straightforward. A statutory employment regime that disqualifies a meaningful slice of the residential trades labor pool, layered on top of a federal enforcement cycle running ten times the 2024 audit pace, layered on top of a Florida-specific 287(g) infrastructure that is the densest in the country, does not produce a marginal labor shortage. It produces a structural one. And that shortage shows up first and hardest in the trades that drive the Florida residential build cycle.


    Who can absorb the shock

    This is where the May 25 builder-consolidation analysis becomes important.

    The national publics with self-perform crews, in-house framing and concrete divisions, captive subcontractor relationships, and balance-sheet capacity to over-hire ahead of crew shortages have a structural cushion the private mid-market builder does not. Lennar reported Q1 2026 net earnings of $0.93 per diluted share — a 57% decline from $2.14 in Q1 2025 — but new orders nonetheless grew 1% year-over-year to 18,515 homes. (Lennar — Lennar Reports First Quarter 2026 Results (March 12, 2026)) PulteGroup reported Q1 2026 home sale revenues of $3.3 billion — down 12% year-over-year — with closings down 7% to 6,102 homes and average selling price down 5% to $542,000. (TradingView — PulteGroup Stock Down on Earnings Q1 Miss, Revenues Beat on Orders) D.R. Horton’s guidance for fiscal 2026 closings is 86,000 to 87,500 homes — close to flat against fiscal 2025’s 84,863 closings. (D.R. Horton — Q1 FY2026 Earnings Release)

    The pattern is the same on the cost side as it was on the demand side: margin compression at the publics, with volume intact. The publics are taking the labor and incentive hit through reduced earnings per share, not through reduced production. They can do that because their scale lets them.

    The mid-market private builder running the same project against the same labor environment cannot.

    The 2025 Florida builder-failure list I cited in last week’s issue makes the contrast plain — Pegasus Builders (Chapter 11 mid-2025, ~$10M debts), Van Der Valk Construction (Chapter 11 April 30, 2025, 58 homeowners affected), Sion Homes (Chapter 7 September 2025, liabilities over $1M against less than $1,000 cash), Phil Kean Designs Inc. (Chapter 11 Subchapter V late November 2025). (Medium — Luxury Home Builders Collapse Across Florida Amid Market Shifts, TheStreet — Luxury Homebuilder Files for Chapter 11 Bankruptcy) Every one of these is a builder with a long track record — and every one of them was operating in the price tier where labor cost is a meaningful share of finished value and the captive-crew advantage of the publics is decisive.

    The mechanism is straightforward. When a Lennar or D.R. Horton project loses framing crew capacity to an enforcement event, the parent company can redirect from another active project, draw on a captive sub network with national reach, or run a forced-buyout incentive package on the next start window to retain crews. The mid-market private builder running off three or four open-market trade partners on a single project does not have any of those levers. The crew that walked off on Tuesday morning does not come back on Wednesday at the same cost basis.

    That is the labor side of the cost-of-capital wedge. The May 25 piece described the financial side — rate-buydown subsidies the publics can offer that the private cannot, land-banking pipelines the publics access through institutional partners the private cannot, mortgage-subsidiary captive financing the private has no analog to. The labor side now sits alongside those three: a fourth structural advantage that flows mechanically to scale, and a fourth structural disadvantage that flows mechanically to anyone without it.


    What this is doing to the surviving lane

    Now I want to clearly mark what follows as my view, not statute.

    The labor crunch, like the financial wedges I wrote about last week, is reshaping the competitive set of Florida residential builders far more aggressively than it is reshaping the demand for code-current new construction. The two effects are not the same and they should be priced separately.

    On the demand side, the labor disruption matters surprisingly little for the HNWI move-up buyer. A buyer absorbing a $1.5M to $4M asset is not price-elastic on a $10,000 to $40,000 finished-cost delta tied to labor pass-through. The end-buyer pool for code-current new construction in the corridors where this matters — Galleria Villages, Turquoise Homes, Waterview, West Bay — is dominated by buyers who pay cash or carry low leverage and who care more about delivery quality and timing than about the marginal cost line. The labor crunch may stretch delivery, but it does not break absorption in this tier.

    On the supply side, the labor disruption matters enormously, but the wedge it creates favors the surviving cohort. The national publics absorb the cost through margin compression and keep producing volume in the merchant-build price tier. The disciplined private developer operating in the HNWI move-up tier passes a portion of the cost through to a buyer who is largely insensitive to it, and protects the rest through trade-partner relationships built over years of consistent delivery. The mid-market private builder running merchant-build economics with open-market crews is the cohort being eliminated.

    That is — in my view — exactly the right competitive set for Florida residential to settle into. Volume merchant-build product needs the scale advantages of the publics to be delivered profitably. The HNWI move-up tier needs the discipline and trade-partner depth of an established private developer that does not need to compete on volume. The mid-market merchant-build segment — the lane that has been hollowing out — was always the structurally weakest because it lacked both the scale of the publics and the price-tier insulation of the disciplined private.


    From the Developer’s Seat

    The labor regime in Florida is not going to ease over the 24-month horizon any disciplined capital allocator should be underwriting against. The statute is in place, the enforcement infrastructure is the densest in the country, and the federal audit pace is structurally higher than it was 18 months ago. Capital deployed into Florida residential between now and the back half of 2027 has to be priced against that reality.

    My view — clearly marked as opinion — is that the labor crunch is one more reason the right structure for Florida residential capital today is patient HNWI and family-office co-investment alongside a disciplined developer operating in the HNWI move-up tier. The leveraged merchant-build lane is exposed to a wedge it cannot close. The volume merchant-build lane is reserved for the publics that have the scale to absorb it. The HNWI lane has the price-tier insulation, the trade-partner relationships, and the patience that the moment actually rewards.

    If you are an accredited investor evaluating Florida residential allocation against this backdrop, I would rather show you the underwriting than argue with you about it. The Lana Investor Memo lays out our active pipeline, the specific projects, the named underwriting, and the structure we use to invest alongside HNWI and family-office capital. It is private, accredited-only, and shared with serious allocators. Reply to this email if you would like to opt in.


    Sources

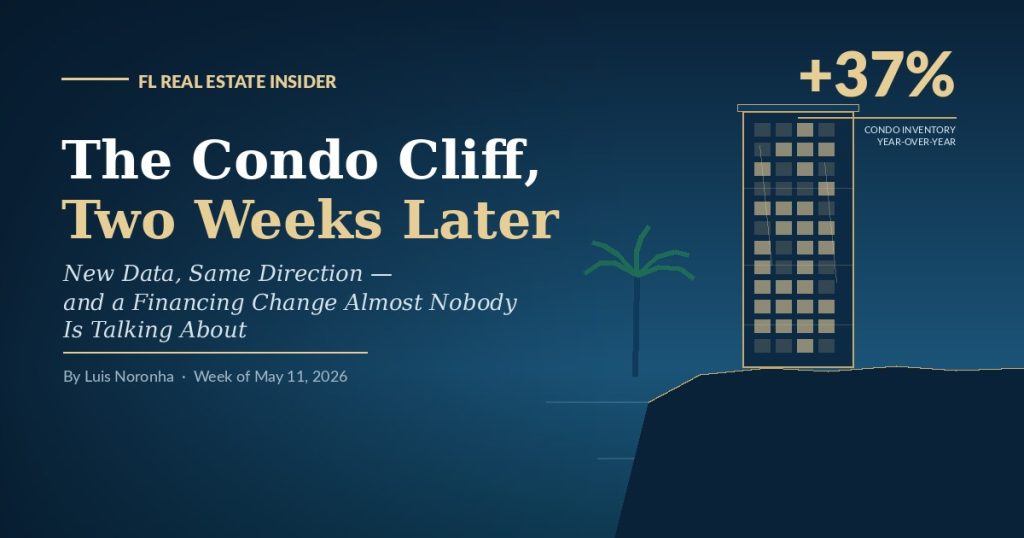
  • The Condo Cliff, Two Weeks Later: New Data, Same Direction — and a Financing Change Almost Nobody Is Talking About

    The Condo Cliff, Two Weeks Later: New Data, Same Direction — and a Financing Change Almost Nobody Is Talking About

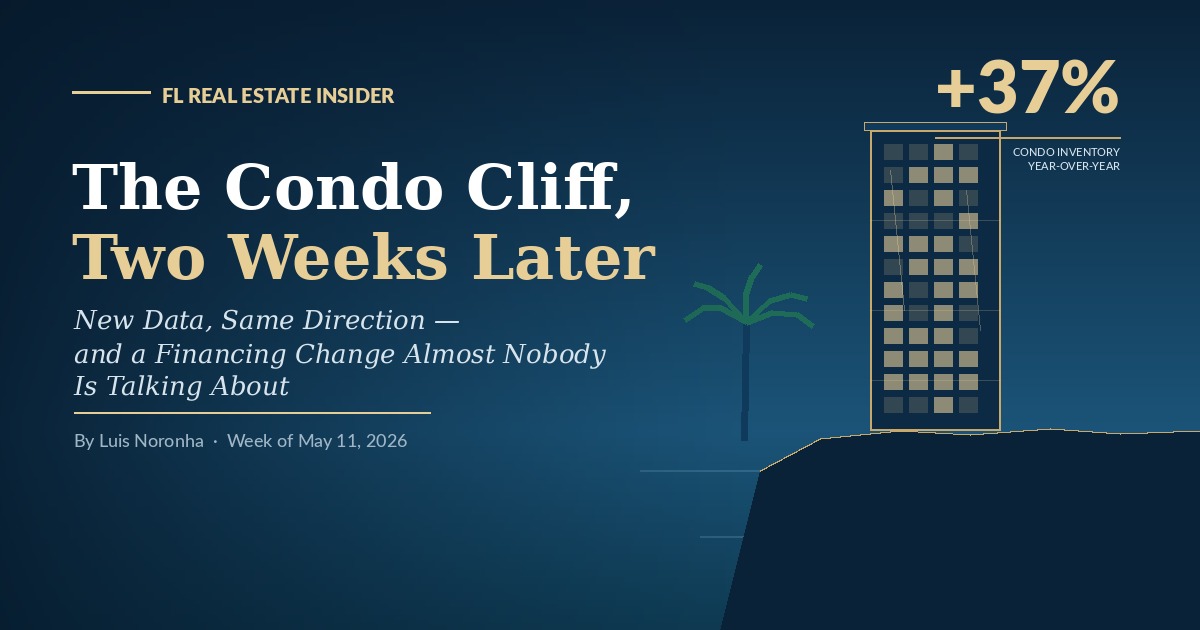
    Florida condo cliff — older oceanfront tower on the edge of the SB-4D financing shift

    New data, same direction — and a financing change in August that almost nobody is talking about

    FL Real Estate Insider — Week of May 11, 2026 By Luis Noronha


    Two weeks ago I wrote that Florida’s older-condo market is at the front of this story, not the back of it — that the reform is right, the transition is being managed thinly, and the market has not yet priced what’s coming. Several readers wrote back asking the same thing in different words: fine, but show me the numbers.

    Fair. So let’s look at what’s actually moved in the last few weeks. Nothing in the data changes the thesis. If anything, it sharpens it.


    The inventory picture

    The clearest signal is supply. Florida condo and townhouse inventory rose from 54,142 active listings in June 2024 to 74,241 in June 2025 — a 37% year-over-year increase — and the trend has continued into the spring 2026 selling season. The condo segment is now sitting at over 13 months of supply, a level that in any normal market would be flashing red. (Tampa Bay 2026 Market Trends)

    Inside that headline, the inventory is not evenly distributed. Newer-build condos are still trading on relatively normal timelines. The supply pileup is concentrated in older coastal buildings — exactly the cohort caught in the post-SB-4D capital cycle, and exactly the cohort I described two weeks ago. (NBC 6 South Florida — surge in condo listings)

    This is what “we are at the front of this story” looks like in data. Supply is building. Pricing in the older segment hasn’t yet fully adjusted to it, because most sellers are still anchored to 2022–2023 comps. That gap — between supply reality and seller expectation — is where the opportunity sits.


    What the assessments actually look like (without making numbers up)

    I refused to quote an “average” assessment last issue, because there isn’t one. There still isn’t. But there is now enough public reporting to talk about ranges responsibly.

    Reporting across covered buildings, particularly 1975–1995 mid- and high-rise towers, shows special assessments commonly in the $30,000 to $75,000 per unit range, with combined roof, concrete restoration, and waterproofing programs producing assessments above $100,000 per unit in the most exposed buildings. Some industry coverage cites a broader observed range of $5,000 to $150,000 per unit, which is consistent with the variance you’d expect across age, reserve discipline, and structural condition. (Florida Realty Marketplace — 2025 Condo Bill, MishTalk — Florida Condo Owners Dump Units)

    The scale of the population affected matters more than any single number: roughly 900,000 Florida condo units sit in buildings 30+ years old and are inside the regulatory perimeter. That is the cohort the market is going to have to digest over the next 24 months. (Aerially — SB-4D Complete Guide)


    The financing change in August that almost nobody is pricing in

    Here is the development that has moved most since the last issue, and that almost none of the residential agents I’ve spoken to are talking about yet.

    Effective August 3, 2026, Fannie Mae is eliminating Limited Review for condominium loans. Every condo loan in a project with more than ten units will require a Full Review. The lender-delegated Full Review covers reserves (15% minimum), insurance adequacy, deferred maintenance, special assessments, and litigation — the exact items SB-4D is forcing out into the open in older Florida buildings. (CommunityPay — Fannie Mae Eliminates Limited Review, BCP Mortgage — Fannie Mae 2026 Condo Guidelines)

    Translation, in plain English: starting in August, the conforming financing path for an older Florida condo runs straight through the same documentation that SB-4D is generating. A building with an incomplete milestone inspection, an unfunded SIRS, or an active uncalled assessment is going to look different to an underwriter on August 3 than it did on August 2.

    For context on where the universe currently sits: as of last summer, only about 3.6% of condo projects nationally were flagged “ineligible” in Fannie Mae’s Condo Project Manager system. The top two reasons: insufficient master insurance and critical repair issues, including failure to meet state or local inspection requirements. With the policy change, the practical bar for a condo loan goes up across the board — and disproportionately in Florida. (Fannie Mae — Ineligible Projects, KSN Law — Fannie Mae Unavailable List)

    There is one favorable counter-development worth naming. As of March 18, 2026, Fannie Mae retired the Florida-specific PERS pre-review step for new or newly-converted attached condo projects, putting Florida new construction back on the same lender-delegated Full Review footing as the rest of the country. That helps new-build supply. It does nothing for the 30-year-old tower with a pending assessment. (Fannie Mae Condo Project Manager FAQs (March 2026))

    The bifurcation between buildings that can be conventionally financed and buildings that effectively cannot is about to get sharper. And it will start showing up in price before the year is out.


    The opportunity I flagged last time, with the timing window now visible

    This is the part where I owe readers more than I gave them in the last issue.

    The case I made was that for the prepared cash buyer or experienced operator, the post-SIRS environment creates real opportunity in older buildings — provided you underwrite the building, not the unit. That is still true. What’s clearer now is the window.

    The SIRS completion deadline is December 31, 2026 — about seven months from today. (Florida Engineering LLC — Building Safety Act 2025 Guide) Between now and then, three things are happening simultaneously:

    1. More SIRS reports are being issued, meaning more buildings move from “unknown” to “documented” — and documented is generally better for a serious buyer than unknown. 2. Inventory is continuing to build in older coastal stock, putting downward pressure on prices in buildings that have not yet completed their cycle. 3. The August Fannie Mae change is going to thin the financed-buyer pool in many of these same buildings, leaving cash buyers and portfolio lenders with less competition.

    Read those three together. The next two to three quarters are the period where a disciplined buyer, willing to do the underwriting work, has the most leverage. After the SIRS deadline passes and the dust settles, the better-managed older buildings will reprice upward as the uncertainty discount comes out. The badly-managed ones will keep drifting.

    The market still has not priced this. It is starting to.


    What I’d tell different people today

    These are the same audiences I addressed two weeks ago. The advice is the same; the urgency is higher.

    If you own in a covered building: Get the SIRS, the milestone inspection, and the current reserve balance, and look at them honestly. If your building is still vague on timing, the August Fannie Mae change is a strong reason to push your board for clarity now. A building that closes 2026 code documented compliance and a credible capital plan is going to trade meaningfully differently than a building that doesn’t.

    If you serve on a board: Communicate. The owners who feel ambushed are the ones who flood the market with simultaneous listings and crater building values for everyone. The boards getting the best outcomes right now are the ones running the most transparent processes — not the ones trying to spin them.

    If you’re a buyer with cash or portfolio financing: This is the underwriting window. Look for buildings that have done the work, priced the work, and started executing — and where seller expectations haven’t yet caught up to the SIRS disclosure. Get the documents before you make an offer, not after. Underwrite the building. Then underwrite the unit.

    If you’re a legislator: A bridge financing or deferred-payment mechanism for long-tenured owners hit by six-figure assessments would still be the right move. We are not running out of time to do this. We are running out of political room to do it cleanly. The Aug 3 Fannie Mae change is going to make the affordability cliff more visible in real time. Please act.


    Bottom line

    Nothing in the data of the last two weeks contradicts what I wrote two weeks ago. The market still hasn’t priced this. The opportunity is still real for the prepared. The window is starting to narrow.

    If you read the last issue and forwarded it to one person, this is the one to forward to a second.

    — Luis


    From the Developer’s Seat

    Several readers wrote back after the last issue with a version of the same question: if the older-condo segment is this dislocated, why aren’t you — a Florida developer — building in it?

    I want to mark what follows as my view from the developer’s seat, not market reporting.

    The economics of ground-up, code-current new construction, in product types where the end buyer is HNWI rather than rate-sensitive, run in the opposite direction of what’s hitting older condos. New product is built to current Florida Building Code and prices accordingly on insurance. It doesn’t trip the Fannie Mae review screens described above, because the deferred maintenance, the unfunded SIRS, and the milestone-inspection backlog simply don’t exist on day one. And in my experience underwriting buyers for new luxury and move-up Florida product, the end buyer is materially less interest-rate-sensitive than the cohort being forced out of impaired older towers.

    The dislocation in the resale-condo segment isn’t a headwind for the new-construction-for-HNWI lane. It’s a tailwind. Capital displaced from impaired older stock has to land somewhere, and well-positioned new product is one of the few places left where it can.

    That is the lane Lana Development builds in — Galleria Villages, Turquoise Homes, Waterview, West Bay. If you’re a HNWI or family-office investor evaluating where Florida residential capital actually has an edge in 2026, reply with “Investor Memo” and I’ll add you to a separate, accredited-only track I’m setting up alongside this newsletter.


    FL Real Estate Insider exists to cover the parts of Florida real estate that get glossed over in the brokerage marketing emails. If this helped, hit reply with the building you’re worried about — I’m happy to point you to a qualified attorney, structural engineer, or broker. No pitch attached.


    Sources

  • Florida New Construction Is Down 31%. The Builders Who Survived Are Not Who You Think.

    Florida New Construction Is Down 31%. The Builders Who Survived Are Not Who You Think.

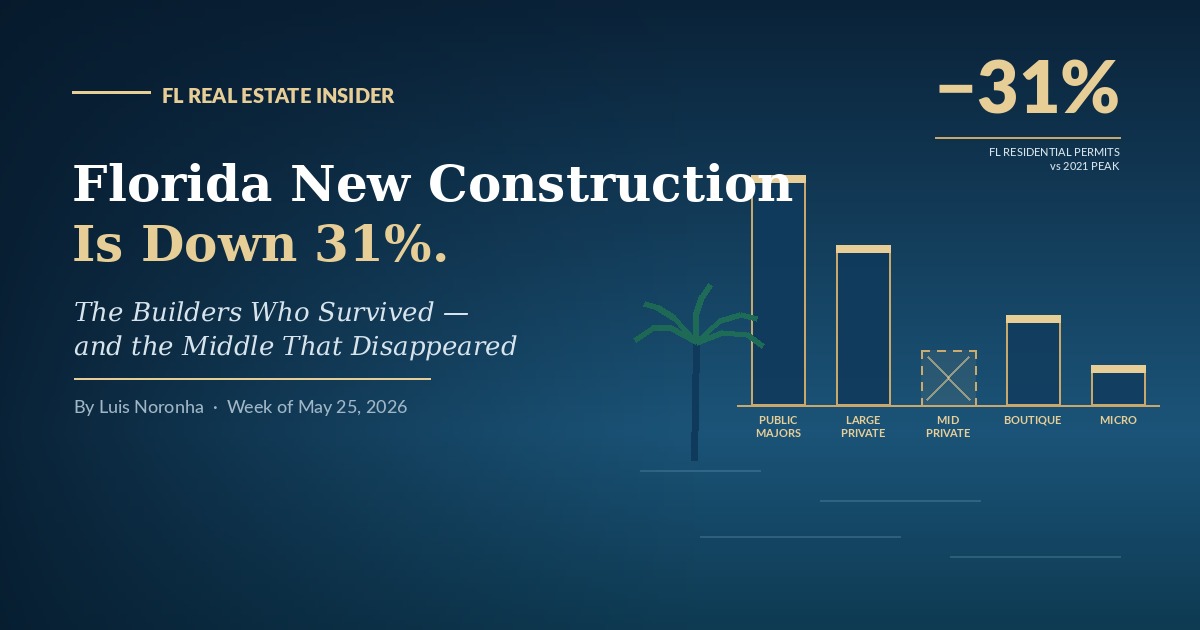
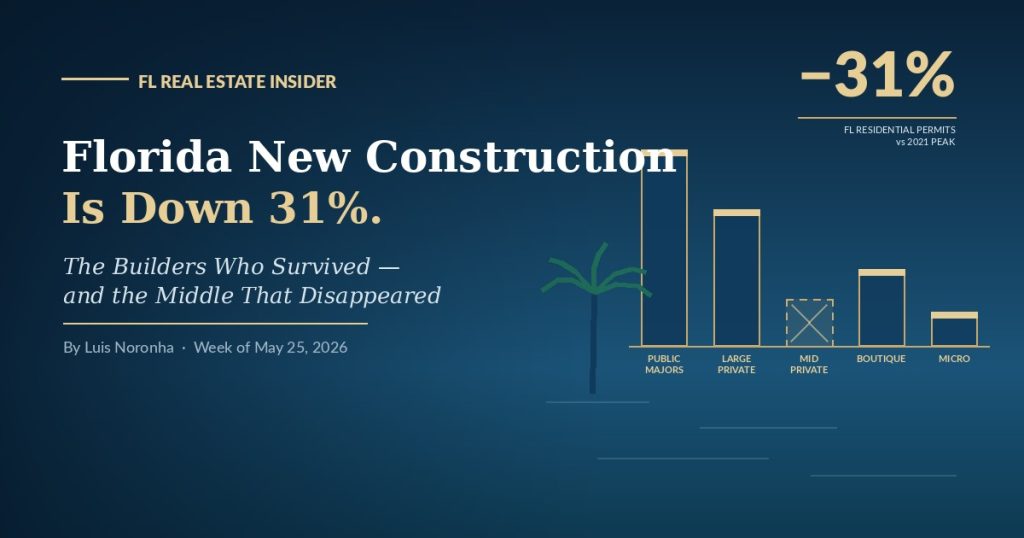
    Florida new construction down 31% — bar chart with hollowed-out mid-market builder tier

    Why the only Florida operators left standing are the very largest publics, the very disciplined privates, and almost no one in between — and what that gap means for capital.

    FL Real Estate Insider — Week of May 25, 2026 By Luis Noronha


    A number that should be on the front page of every Florida real estate publication this spring, and instead is in almost none of them: Florida residential building permits are down roughly 31% from the 2021 peak. (Shovels — Florida Housing Market Outlook: What Building Permit Data Says)

    That is not a normal-cycle slowdown. That is a structural reset of the supply side of the Florida new construction market, and the part of the story that nobody is telling cleanly is who is still building and who is not.

    This week I want to lay out what the permit data actually shows, what the public homebuilders’ first-quarter 2026 earnings actually say about Florida, what is happening to the private builder cohort that used to fill the middle of this market, and — clearly marked as opinion — what I think it means for capital allocated to ground-up Florida new construction over the next 24 months.


    What the Florida new construction volume numbers actually say

    Shovels’ Florida permit dataset shows roughly 66,460 new residential construction permits reviewed in 2025, down from 96,951 in 2023 — a 31% reduction in volume. The cycle low was 2024, when the year-over-year drop hit 21%; 2025 ticked up 1.4%, which is meaningful as a floor signal but is a long way from a recovery. (Shovels — Florida Housing Market Outlook)

    The U.S. Census Bureau’s monthly Building Permits Survey for Florida confirms the directional read in the official federal data and is the place to verify any single-month or single-county number. (U.S. Census Bureau — Building Permits Survey, State Monthly, FRED — New Private Housing Units Authorized by Building Permits for Florida (FLBPPRIV))

    The headline read most coverage settles on is “Florida is overbuilt and needs to absorb.” That is half right. The state did overbuild specific submarkets in 2021–2022 — Southwest Florida especially — and the inventory in those metros is still working off. But the permit number is a forward indicator of supply, not a backward indicator of absorption, and what it is telling you is that the operators who can pull permits at scale in Florida today are a much smaller and much more concentrated group than they were four years ago.


    Who is still building: the publics are eating the market

    Inside Florida, the share concentration at the top is severe. Lennar led Florida permits in early 2026 at roughly 1,111 permits, D.R. Horton at 690, PulteGroup at 379. (HBWeekly — Florida’s Top Home Builders, December 2025 Market Snapshot, HBWeekly — Florida Top Home Builders, January 2026) Nationally, D.R. Horton closed more than 87,000 homes in 2025 — the No. 1 spot it took from Lennar two years earlier. (Builder Magazine — The 5 Home Builders Leading the Nation in Closings)

    That concentration is being held up by an incentive package smaller competitors cannot match. Lennar reported Q1 2026 sales incentives at roughly 14% of sales price, against a historical average of 4% to 6%, and new orders nonetheless grew 1% year-over-year to 18,515 homes. (Lennar — Form 10-Q for the quarter ended February 28, 2026, FinancialContent — Lennar Q1 Earnings Signal Shift in Housing Market) D.R. Horton’s Q1 2026 homebuilding revenue fell 9% to $6.5 billion and pre-tax homebuilding income fell 30% — yet new sales orders were up year-over-year. (D.R. Horton — Q1 FY2026 Earnings Release)

    The mechanism is the captive mortgage subsidiary. DHI Mortgage, Lennar Mortgage, and Pulte Mortgage can deliver below-market rate buydowns — typically 100 to 200 basis points, plus closing-cost credits — on the parent’s own inventory, financed off the parent’s balance sheet. (The Globe and Mail — Homebuilder Earnings: D.R. Horton Sticks Out as Pulte & NVR Sales Tank) A small or mid-sized private builder cannot match that package without taking the project to a loss.


    The land-banking layer that institutionalized the gap

    The second structural advantage is one almost no consumer-facing Florida real estate coverage has connected to homebuyer outcomes: the land-banking spin-off model.

    On February 7, 2025, Lennar completed the taxable spin-off of Millrose Properties, advancing what it has called since 2013 a strategy of becoming a “pure-play land-light manufacturer of homes.” Millrose buys and develops residential land, then sells finished homesites back to Lennar under option contracts with predetermined costs and takedown schedules. It is externally managed by Kennedy Lewis Land and Residential Advisors, an affiliate of Kennedy Lewis Investment Management — an institutional firm with more than $25 billion in assets under management. (Lennar — Lennar Completes Spin-off of Millrose Properties (Feb 7, 2025), SEC — Millrose Properties Form 424B1, FY2025)

    A mid-sized Florida private builder bidding against a Millrose-funded lot takedown is, in effect, bidding against Kennedy Lewis. Industry coverage of the broader sector notes that “you can’t attend an industry conference without encountering multiple new land bank funds.” (HousingWire — Understanding Homebuilding’s New Capital Partner: Land Banking, John Burns Research and Consulting — Land Banking Grows as Housing Industry Strategy)


    The private-builder cohort being squeezed

    The other end of the same trend is now showing up in the bankruptcy docket. The Florida 2025 builder-failure list is not a list of small operators that got over their skis — it is a list of well-known builders with long track records:

    The common factors in the post-mortems are not surprising — insurance during construction roughly doubled across the 2022–2024 cycle, materials cost volatility caught builders working off fixed-price contracts, and labor markets stayed tight — but the structural explanation is the cost-of-capital gap. When the largest publics can self-fund a rate buydown, schedule a finished lot off an institutional land bank, and underwrite a project on volume economics, the private builder running the same project off a regional bank construction loan and a self-financed lot is competing on a different P&L.

    Industry M&A is the next step in the same pattern. New Home Co. completed its acquisition of Landsea Homes Corporation in early 2026, creating a privately-held top-25 national homebuilder — a transaction explicitly framed by both parties as a defensive response to scale-driven cost-of-capital pressure. (Rise Well Homes — New Home Co. Completes Acquisition of Landsea Homes Corporation)


    The lane the publics structurally don’t serve

    Here is the part of the story that matters for the audience this newsletter is actually written for.

    The volume-merchant new-construction model the publics run in Florida — D.R. Horton’s median price tier, Lennar’s median tier, Pulte’s median tier, plus the rate-buydown package — is overwhelmingly aimed at the first-time and first move-up financed buyer below the conforming loan limit. It is built around mortgage origination. It is not built around the buyer profile that is currently driving the Florida price tiers that are not softening.

    That buyer profile is cash, and at the top of the market it is overwhelmingly cash:

    The customer in those numbers does not need a 200-basis-point rate buydown. The captive-mortgage advantage that the publics use to dominate the first-time-buyer market is irrelevant to a cash buyer at the top of the market. And the volume-merchant production model the publics run is structurally bad at producing the customized, code-current, primary-residence product that cash cohort actually wants — partly because it does not match their distribution, partly because the margin math on a custom-spec project does not fit a public homebuilder’s quarterly earnings cycle, and partly because the publics have spent the last decade explicitly de-emphasizing the land-heavy custom-spec model in favor of asset-light merchant-build.

    That is the lane.


    What I think — clearly marked as opinion

    I want to clearly mark what follows as my view, not data.

    Read together, the 31% permit decline, the public-builder incentive escalation, the land-banking buildout, and the private-builder failure list are not four separate stories. They are one story: the Florida new-construction supply side is being squeezed into two viable lanes and hollowed out everywhere in between.

    Lane one is the merchant-build volume tier the publics dominate, and they will keep dominating it. Trying to compete with D.R. Horton in 2026–2027 on a 25-home subdivision priced at a first-time-buyer mortgage is, for almost any private builder, a strategic mistake.

    Lane two — the one that matters to a serious capital allocator — is custom-spec, code-current, primary-residence product priced for the cash and HNWI move-up buyer. That lane has three durable advantages right now that I do not believe are temporary:

    First, the end buyer pays cash, so the rate-buydown dynamic that decides the financed tiers does not apply. Lane two competes on product, location, and execution.

    Second, the supply side in lane two has measurably thinned as the small and mid-sized private builders who used to fill it either failed, sold to a larger platform, or moved into project-management work for a public. Less competition for the same end-buyer demand is the most direct definition of pricing power I can give you.

    Third, the structural tailwinds I have flagged in recent issues — the insurance wedge in favor of code-current construction, the GSE underwriting wedge in favor of code-current condos, the property-tax reform conversation that disproportionately rewards homesteaded primary residences — all flow through this exact lane. (Background: The Florida Property Tax Fight, Without the Talking Points, The Condo Cliff, Wall Street Landlords.)

    The counterpoint to my own thesis: this is not a permanent moat. The publics are smart, the institutional land-bank vehicles will eventually reach further up the price tier, and the cash-buyer pool can soften if global liquidity conditions change. The reading I am giving you is a 24-to-36-month view, not a 10-year view. But on that horizon, the structural setup is as favorable as I have seen it in this cycle.


    From the Developer’s Seat

    This section is my view, not data.

    The single sentence I would offer a sophisticated capital allocator looking at Florida new construction right now: the operators left standing in the lane I would want to deploy into are a much smaller, much more identifiable group than they were three years ago — and the structural advantages of being in that group are widening, not narrowing.

    Patient, code-current, custom-spec primary-residence development priced for the HNWI move-up and cash buyer is the lane Lana is built for. It is also the lane in which family-office and HNWI capital — patient, willing to underwrite a 24-month ground-up cycle, earning co-invest economics no institutional REIT can match — has its largest structural edge.

    If you are an accredited investor and want to see how this thesis is expressed in named, live Lana projects with full underwriting transparency, that is what the Lana Investor Memo exists for. Reply to this email and I will add you to the next memo distribution.


    Sources

  • The Florida Luxury Buyer in 2026: Tighter, Wealthier, and More Durable Than the Headlines Suggest

    Draft — full content pending paste.

    Here’s the full long-form article — same file I pushed into WP draft 149. Paste-ready:


    The “Florida is cooling” story is true for the median household and quietly false for the buyer who actually clears new luxury and move-up product. Here is what the data show — and what they mean for capital.

    FL Real Estate Insider — Week of June 8, 2026 By Luis Noronha


    There are two Florida housing markets right now, and almost every headline you have read this spring is describing only one of them.

    The first market is the one in the headlines: cooling migration, rising inventory, price cuts on the Gulf Coast, a median sale price that slipped 1.3% year over year to about $394,000 in the first quarter. That market is real, and if you own a 2004-vintage condo in an overbuilt corridor, it is the only market you can feel.

    The second market is the one I underwrite for a living — the buyer of well-built, code-current new luxury and move-up product. And in that market, the data is telling a very different story: fewer buyers than five years ago, but the ones who remain are wealthier, less leveraged, and more committed than at any point in recent memory.

    This week I want to lay out what the numbers actually say about the Florida luxury buyer in 2026, where the demand is concentrating, and — clearly marked as opinion at the end — what I think it means for capital deployed into ground-up Florida new construction.


    The migration story is more interesting than “it’s slowing”

    Start with the headline everyone leads with. Florida’s net domestic in-migration fell from 310,892 in 2022 to just 22,517 in 2025 — a roughly 93% collapse over three years, dropping Florida to eighth among the states for state-to-state migration. (Newsweek)

    That number is real. It is also incomplete in two ways that matter enormously if you are selling — or financing — luxury product.

    First, the migration is cooling, not reversing, and the people still arriving are dramatically wealthier than the people leaving. The most recent IRS migration data shows Florida captured a net $20.6 billion in adjusted gross income from interstate migration — nearly four times the gain of second-place Texas at $5.5 billion. The average AGI of a tax filer who moved to Florida from another state was $122,530, the highest of any state in the country, and the households arriving earned on average roughly 60% more than the households that left. (Florida Realtors) Palm Beach County alone posted a net income inflow of $22.7 billion from domestic migration over 2019–2023, ranking it first in the nation. (MIAMI REALTORS)

    Second, the international channel — the one that disproportionately feeds the Florida luxury market — is still running at the top of the country. In 2025 Florida led every state in net international migration, with 178,674 more people arriving from abroad than leaving. (Florida Realtors)

    So the honest read of the migration data is not “Florida is emptying out.” It is “the price-elastic middle-class family buyer is being squeezed out by affordability, while the high-income domestic mover and the international buyer — the two cohorts that actually clear luxury product — are still here.” The demand base is not shrinking so much as it is sorting.


    The luxury buyer is paying cash — which means rates barely touch them

    Here is the single most important fact about the Florida luxury buyer in 2026, and it is the one that explains why this cohort is insulated from the mortgage-rate environment that is punishing everyone else: at the top of the market, this is a cash market.

    In the million-dollar condominium and townhome segment, more than 70% of sales close all-cash — and in the wealthier coastal counties the share is far higher: 70% in Miami-Dade, 71% in Broward, 86% in Palm Beach, 87% in Martin, and 95% in St. Lucie. (WORLD PROPERTY JOURNAL) For Miami condos specifically, 82% of sales above $1 million in 2025 were all-cash. (Haute Residence)

    When the buyer pays cash, a 7% mortgage rate is not a gate — it is a footnote. As one Palm Beach market read put it, in the high-end segment liquidity, not leverage, is setting the pace. (MILLION) That is exactly why the luxury tape and the broad tape have decoupled this cycle. The rate-sensitive buyer paused; the cash buyer did not.

    And the cash buyer kept buying. Closed sales of single-family homes priced above $1 million rose 15.2% year over year in April 2026 statewide. (letsmovetofla) In Miami, $1 million-plus single-family sales jumped 21.34% year over year, from 164 to 199 transactions. (Haute Residence) At the very top, sales above $10 million stayed historically active — 262 transactions in the first nine months of 2025, on pace for roughly 426 by year-end, close to the 2021 record. (MILLION)


    The supply picture is split down the same line as the demand picture

    This is where the two-markets framing becomes impossible to miss. Look at months of supply — the cleanest measure of who has pricing power.

    Florida single-family inventory tightened to 4.8 months of supply as of April 2026, and is projected to keep tightening toward 4.2 months by end-2027. Condo inventory, meanwhile, sat at 10.8 months — more than double — with the overhang concentrated in exactly the aging, pre-code, assessment-burdened stock I wrote about in The Condo Cliff. (MILLION)

    That is the whole story in two numbers. The well-built single-family and new-construction product the luxury buyer wants is getting scarcer. The older condo stock that buyer does not want is getting more abundant. Same state, same month, opposite markets.


    The wealth being created is structural, not a sugar high

    It would be easy to dismiss all of this as a post-pandemic hangover that fades. The wealth data says otherwise.

    Knight Frank’s 2026 Wealth Report — its twentieth edition — counts the global population of ultra-high-net-worth individuals (those worth more than $30 million) rising from 551,435 in 2021 to 713,626 in 2026: roughly 89 people crossing the $30 million threshold every single day. The United States created 41% of all the new UHNWIs in that period, lifting its share of global ultra-wealth from 33% to 35%. And 22% of UHNWIs plan to buy a luxury home this year. (Knight Frank, Think Global People)

    Florida sits directly in the path of that capital. Miami-Dade alone added 50% more millionaires over the past decade. (Family Wealth Report) The buyer pool for Florida luxury is not a pandemic artifact that reverts. It is being replenished, structurally, faster than the state can build product for it.


    From the Developer’s Seat

    What follows is my view, not statute or data — I want to mark that clearly.

    Here is what I take from all of this. The dominant 2026 narrative — affordability cliff, migration reversal, a cooling market — is accurate for the median Florida household and increasingly misleading for the buyer of code-current new luxury and move-up product. Those are two different markets, and the data has pulled them apart this cycle more cleanly than I have seen in fifteen years.

    The buyer who clears the kind of product I build is, today, more durable than at any point in the last five years: wealthier on arrival, paying cash, insulated from rates, drawn by lifestyle rather than a job relocation that can be reversed by a return-to-office memo, and being replaced from a global wealth pool that is growing by the day. Fewer total buyers — but the remaining ones are exactly the buyers a disciplined developer wants, and they are competing over a single-family and new-construction supply that is getting tighter, not looser.

    For an HNWI or family-office investor, the strategic point is this: the slowdown everyone is reading as a reason for caution is, in the luxury and move-up lane, a sorting mechanism that is concentrating demand into precisely the product code-current ground-up new construction produces. Backing a developer who builds for that durable end buyer is not a bet against the Florida cooling — it is a bet on which side of the cooling you are standing on.

    If you want to see how this buyer-durability framework applies to the live Lana pipeline — the specific corridors, the specific end-buyer profile, and the underwriting behind it — that is exactly the conversation the Lana Investor Memo is built for.

    → Request access at coastal-living-collection.com (accredited investors only).

    Until next week, Luis

    P.S. — Accredited investor? The Lana Investor Memo and the live pipeline behind this week’s thesis live here: coastal-living-collection.com.


    Sources


  • The Florida Property Tax Fight, Without the Talking Points

    What is actually on the table in 2026, what is not, and who would quietly win if any of it reaches the ballot

    FL Real Estate Insider — Week of May 18, 2026 By Luis Noronha


    For the last six months, every Florida real estate conversation I have been in eventually turns to the same question: “is the property tax thing actually happening?” The honest answer is that the political pressure is real, the proposals are real, and the mechanics of who would benefit are very real — but almost none of the public commentary you have read about it is accurate enough to use.

    So this week I want to do something different. I want to lay the actual proposals out side by side, with the bill numbers, what each one would do mechanically, where each one died in this past session, and what each would mean for a Florida property owner depending on whether you live in your house, rent it, or hold it as an investment.

    Then I will mark — clearly — what I think, separate from the statute.


    What is actually on the table

    Florida’s 2026 regular session produced a cluster of House Joint Resolutions aimed at homestead property taxes. They are not interchangeable. Each does something different, each cleared a different point in the process, and each carries a different bet about who benefits.

    HJR 203 — phased elimination of non-school property tax on homesteads. Increases the homestead exemption from non-school ad valorem taxes by $100,000 per year for ten years beginning in 2027, until homesteaded primary residences are fully exempt from non-school property tax by 2037. School property taxes are preserved. HJR 203 passed the House 80–30 on February 19, 2026 — the only proposal to receive a floor vote — and then died in the Senate Appropriations Committee when the regular session ended March 13, 2026 without a hearing. (HJR 203 bill page, Florida House, Florida Phoenix coverage, Florida Policy Institute bill summary)

    HJR 209 — a new $200,000 second homestead exemption conditioned on carrying comprehensive property insurance. Stacks on top of the existing homestead exemption, applies only to non-school ad valorem taxes, and applies only to homesteads carrying a comprehensive multiperil policy. The Revenue Estimating Conference put the local-government revenue cost at roughly $8.6 billion per year, and the legislative analysis estimated that about 83 percent of Florida homesteaded homeowners would qualify. HJR 209 cleared all of its committees but died on the Second Reading Calendar without a floor vote. (HJR 209 bill page, Florida House, Florida Policy Institute bill summary)

    HJR 213 — reassess homestead property every three years instead of every year, with the cumulative cap held at 3 percent or CPI. Materially slows assessed-value creep for long-tenured homesteaders. Cleared committees, died on the Second Reading Calendar. (Florida Policy Institute bill summary)

    HJR 211 — remove the $500,000 cap on Save Our Homes portability. Allows a homesteader to transfer the full accumulated SOH benefit to a new primary residence, not just the first $500,000. Stalled before Ways and Means. (Pegasus Lends portability summary, Florida Policy Institute bill summary)

    HJR 201, 205, 207 — additional homestead-exemption increases of varying sizes and structures. All stalled before Ways and Means. (Florida Policy Institute bill summary)

    Net of all of that: the 2026 regular session produced exactly one proposal that made it to a full chamber vote, and the April 2026 special session — which also covered the budget — adjourned without putting any property tax measure on the November 2026 ballot. (WFLX coverage of session end, Barnes Walker post-session update)


    What everyone is now waiting on

    The path forward, if there is one, runs through a third special session this summer. Governor DeSantis has signaled July or August 2026 as the likely window, contingent on a deal with the Senate. To get a constitutional amendment on the November 2026 ballot, both chambers need to approve it with a 60 percent supermajority, and the Secretary of State has a late-August certification deadline. Voters would then need to approve the amendment with a 60 percent supermajority to ratify it. (Fox Business — DeSantis phased approach, WFLX — third special session)

    The Senate is the real story. Senate President Ben Albritton has been explicit that the Senate is not ready to send a property tax amendment to the ballot without first solving for the impact on what he has called Florida’s “fiscally constrained” counties. Senate Appropriations Chair Ed Hooper put it more plainly: “There’s 67 totally different counties in this state, and a property tax issue that is great for one county could crush 31 poor counties.” (Florida Voice — Albritton final message, Florida Realtors — Lawmakers continue work on property tax plan)

    That is the negotiating wall. The House wants to give voters an option in November. The Senate wants to first answer the question “and how do small counties pay for sheriffs and roads?” before it agrees to anything.


    The replacement-revenue math, which is the part nobody on the political side wants to be specific about

    The piece of this that the talking points consistently soft-pedal is what replaces the revenue. Florida’s homestead non-school property tax base is large enough that the only credible single-lever replacement is a substantially higher sales tax. The Florida Policy Institute’s analysis concluded that fully replacing the lost revenue with sales tax would require Florida to roughly double its state sales tax to about 12 percent — which would be the highest state sales tax rate in the country. (Kiplinger summary of FPI analysis)

    Florida TaxWatch has not endorsed elimination either. Brandi Gunder, Florida TaxWatch’s vice president for research, said publicly that “tax levies are growing at an unsustainable pace” but also that any restructure “has to be a partnership between local, state — everybody on board to know how critical government services will be funded.” (WUSF — TaxWatch on property tax elimination)

    Translation: even the conservative-leaning fiscal watchdog is not going to wave this through without a credible replacement plan.


    What the live bills would actually do, for the actual people who own actual property

    This is where most of the public commentary breaks down. Let me put the mechanics in plain English.

    If you own and live in your home (homesteaded primary residence): every live proposal benefits you, on different timelines. HJR 209 would deliver the biggest immediate cut on day one — a $200,000 additional exemption stacked on the existing $50,722 baseline exemption (propertyexemption.com — Save Our Homes 2026 guide), conditional on carrying comprehensive insurance, for a total exemption around $250,722 on non-school taxes. HJR 203 would deliver a deeper cut but over a decade. HJR 213 would slow your assessed value growth. HJR 211 would let you carry your full SOH benefit to your next primary residence with no $500,000 cap.

    If you own a second home, an investment property, an Airbnb, or commercial property: none of the live proposals reduce your property tax. The phased elimination in HJR 203 specifically excludes non-homestead property; HJR 209 explicitly excludes non-homestead property; the SOH-related proposals are structurally tied to homestead status. The existing 10 percent non-homestead assessment cap (Florida Statute 193.1556) continues to apply, with the standard reset to full market value upon ownership change. (Pinellas County PA — Non-Homestead 10% Cap)

    If you rent in Florida: none of these proposals delivers you direct relief, and the replacement math is structurally regressive — sales tax falls more heavily on lower-income households as a share of income than property tax does. (Kiplinger summary of FPI analysis)

    If you are about to close on a new construction primary residence: this is the corner of the market that gets the least public attention and where the mechanics are most interesting. Under existing law, new construction is reassessed at full market value as of the first January 1 after substantial completion, and is added to the capped assessed value of the land. Once homestead is filed, the 3 percent (or CPI) Save Our Homes cap kicks in for the following year. (Florida Department of Revenue — Property Tax Information for First-Time Florida Homebuyers (PDF), § 193.155, Florida Statutes) Layering HJR 209 or HJR 203 on top of that mechanic would compress non-school property tax on a new code-current primary residence faster than on essentially any other asset class in the state.


    What I think — clearly marked as opinion

    I want to clearly mark what follows as my view, not statute.

    The political framing of this debate has been “homeowners versus government,” and that framing is making people miss the more important story. Every live proposal that came out of the 2026 session — HJR 203, HJR 209, HJR 213, HJR 211, all of them — concentrates the benefit on owner-occupied primary residences. By design. Some of them go further and condition the benefit on the property carrying insurance that an actual carrier is willing to write, which in Florida in 2026 means a structure built to current code is materially advantaged over older, harder-to-insure stock.

    If any version of this package reaches the November 2026 ballot and passes, three things follow.

    First, the relative carrying cost of a homesteaded primary residence drops, and drops most for higher-assessed-value homes — which is the segment with the largest absolute non-school millage bill. That is a transfer toward the move-up and luxury primary-residence buyer, which is the segment new code-current construction is built for.

    Second, the relative carrying cost of investor-held inventory — second homes, short-term rentals, institutional single-family-rental portfolios — does not drop. The owner-occupied buyer is being explicitly advantaged versus the investor buyer at the margin. That is a small but real tailwind for end-buyer-driven new construction and a small but real headwind for institutional SFR exposure in Florida — which builds on the pattern I have written about in prior issues. (FL Real Estate Insider — Wall Street Landlords)

    Third, the insurance-conditioned design of HJR 209 specifically rewards buildings that current Florida carriers are willing to write — which means, in practice, FBC-current construction. The reform package and the insurance market are quietly pointing at the same asset.

    I am not predicting any of these proposals passes. The Senate roadblock is real, the replacement-revenue problem is unsolved, and the political appetite for raising sales tax to 12 percent does not exist. The most likely outcome remains a partial package — most plausibly some form of HJR 209 (insured-homestead exemption) plus an expanded portability fix — rather than full HJR 203 elimination.

    But the part of this that will happen, whatever the November ballot ends up looking like, is that the political conversation is now permanently anchored on giving more of the tax relief to owner-occupied primary residences. That anchor is not moving. And whoever is positioned to sell or hold owner-occupied primary residences in Florida is on the right side of that anchor.


    From the Developer’s Seat

    This section is my view, not statute.

    I read the entire 2026 property tax package as a slow tilt of the rules toward exactly one buyer profile: the homesteaded, well-insured, primary-residence owner of a code-current Florida home. Every live proposal advantages that buyer. The 10 percent non-homestead cap (and the reassessment-on-sale mechanic) keeps the rules less favorable for investor-held and second-home inventory. The insurance condition in HJR 209 quietly favors structures that today’s carriers will write — which means structures built to current FBC. None of this is accidental.

    The practical implication for capital is straightforward. The Florida residential lane with the most political wind at its back is owner-occupied, code-current, primary-residence new construction priced for an HNWI move-up buyer. That is the lane Lana operates in. It is also the lane in which family-office and HNWI capital has a structural advantage over institutional capital, because the holding period, the buyer profile, and the underwriting risk are all things patient private capital handles better than a public REIT or a Wall Street SFR vehicle. If you are an accredited investor and want to see how this thesis is actually expressed in live projects with named underwriting, that is what the Lana Investor Memo is for. Reply to this email and I will add you to the next memo distribution.


    Sources

  • Florida Just Handed Real Estate Investors a New Way to Hold Property

    The Protected Series LLC is now law — in effect since July 1. It looks like a convenience. It’s really a competence test — and the smart money will pass it by default.

    FL Real Estate Insider — Week of July 20, 2026 By Luis Noronha


    Three weeks ago, on July 1, a quiet change in the Florida Statutes became one of the most consequential shifts in how Florida real estate is owned in years — and almost nobody outside a handful of law firms is talking about it.

    Florida’s new Protected Series LLC law took effect that day. It lets a single parent LLC create multiple internal “series,” each with its own assets, its own members, and — this is the part that matters — a statutory liability wall between them. Hold ten properties in ten series, and a slip-and-fall judgment at one property is supposed to stay at that property, instead of reaching across and threatening the other nine. No ten separate companies. No ten sets of annual filings. One entity, walled off internally.

    That’s the headline, and the legal blogs have covered the headline. What they’ve mostly skipped is the part a serious investor actually needs to hear: this structure is powerful, and it is unforgiving. It rewards discipline and quietly punishes everyone who treats it as a checkbox. Let me walk through what it is, and then I’ll tell you — marked plainly as my opinion — what I think it really signals.


    What actually passed

    The law is CS/SB 316, sponsored by Sen. Lori Berman, with a companion bill CS/HB 403 from Rep. Jenna Persons-Mulicka. Governor DeSantis signed it on June 20, 2025, with a delayed effective date of July 1, 2026 — the delay was requested by the Florida Department of State to give it time to build the new forms and filings into its systems. It adds new Sections 605.2101 through 605.2802 to the Florida Revised Limited Liability Company Act (Chapter 605), and it’s modeled on the Uniform Protected Series Act that the Uniform Law Commission promulgated in 2021. (Holland & Knight — Florida Passes New Protected Series LLC LegislationShumaker — Governor DeSantis Signs SB 316Florida Senate — CS/SB 316 Bill Summary)

    That last point matters more than it sounds. Florida didn’t invent something experimental here. Delaware has had series LLCs since 1996; Illinois, Nevada, Texas, and others followed. Florida studied all of them and built its version on the uniform framework — which means the law is comprehensive and the courts have a reasoned structure to work from, rather than the thin, untested statutes some states are stuck with. (Holland & Knight)

    Here’s how it works in practice. An existing or newly formed Florida LLC acts as the “parent.” It creates a series by filing a “protected series designation” with the Department of State, with the unanimous consent of its members (unless the operating agreement allows less). Each series gets a name that has to begin with the parent’s name and include “protected series,” “P.S.,” or “PS.” From there, each series can have its own members, managers, purpose, and — critically — its own assets and liabilities, walled off from the parent and from every other series. (Holland & KnightMunizzi Law — What Investors Need to Know Before July 1, 2026)

    The drafters had real estate squarely in mind. The plain-language example used by the chair of the Florida Bar committee that wrote the law: “a real estate developer could have a series for residential housing, another for mixed-use and others for retail, commercial, office, golf courses, restaurants, healthcare, etc.” — one entity, an unlimited number of internally segregated buckets. (Holland & Knight)


    The “horizontal shield” — and the catch that voids it

    The genuinely new thing the law creates is what the statute calls a “horizontal” liability shield. Traditional LLCs give you a vertical shield — it protects the owners from the company’s debts, the way shareholders are protected from a corporation’s debts. The horizontal shield is different: it runs sideways, between series, so the creditors of one series can only reach that series’ assets — not the parent’s, and not any other series’. It has two parts: a non-liability rule (one series isn’t liable for another’s debts) and a non-recourse rule (a creditor can’t reach into another series’ assets). (Holland & Knight)

    Now the catch — and this is the entire piece.

    That shield only exists if you keep the records to support it. The statute requires strict, contemporaneous recordkeeping that segregates the “associated assets” and “associated liabilities” of each series. The legal standard, written into Section 605.2301(2)(a), is that your records must describe each asset with enough specificity that a “disinterested, reasonable individual” could identify the asset, distinguish it from every other series’ assets and the parent’s assets, determine when and from whom the series acquired it, and — if it came from the parent or another series — determine what was paid for it. (Holland & Knight)

    Miss that standard, and the protection doesn’t just weaken — under the piercing-the-veil doctrine, a creditor can pierce both the horizontal shield and the vertical shield, exposing the other series and the parent. (Holland & KnightFlorida Bar Journal — Florida’s New Protected Series LLC Law, Part I) In plain English: sloppy books don’t just cost you the new protection. They can blow up the protection you already had.

    A few more things worth knowing before anyone gets excited:

    • Foreign LLCs can’t use it directly. An out-of-state LLC can’t create a Florida protected series — it has to form or domesticate a Florida parent first. (Holland & KnightBerger Singerman — Florida’s Series LLC Law Takes Effect July 1, 2026)
    • Other states may not honor the wall. Several states don’t recognize series LLCs at all, and there’s no guarantee their courts will respect the internal shields on a property or lawsuit in their jurisdiction. If your holdings cross state lines, the protection is only as good as the least-friendly court that touches it. (Holland & Knight)
    • The financing and title plumbing is still catching up. The lending and title-insurance industries have not fully standardized how they underwrite, insure, or finance individual series. Anyone planning to mortgage a property held in a series should confirm lender and title acceptance before committing to the structure, not after. (Munizzi LawBerger Singerman)

    None of that makes the tool bad. It makes it a tool for people who do the work.


    What I’d actually tell people

    If you hold multiple Florida properties personally or in one big LLC: This is worth a real conversation with your attorney and CPA before year-end. The appeal — one entity, segregated risk, fewer filings than ten separate LLCs — is genuine. But the protection lives and dies on administration, so go in knowing you’re signing up for disciplined, separate bookkeeping per series, not a set-it-and-forget-it shortcut.

    If you already run a clean, well-documented operation: You’re the ideal candidate. The structure rewards exactly the habits you already have.

    If your books are a shoebox: Be honest with yourself. A protected series with sloppy records is arguably worse than what you have now, because the same sloppiness that voids the new horizontal shield can be used to pierce the vertical shield you were relying on. Fix the bookkeeping first, or don’t use it.

    Everyone: This is general education, not legal advice — and the people who get series LLCs wrong almost always got them without counsel. Talk to a Florida attorney who does this work. (My own real estate legal work runs through Duane Morris; structure decisions like this are exactly the kind of thing I’d never do off a blog post, including this one.)


    Bottom line

    Florida just added a genuinely useful tool for owning real estate — and wrote it so that the tool only works for people disciplined enough to run it properly. The wall between your properties is real, but it’s made of recordkeeping, and it falls down the moment the recordkeeping does.

    If you take one thing from this issue: the Protected Series LLC isn’t a convenience. It’s a competence test. And whether you pass it has nothing to do with the filing fee and everything to do with how you already run your business.

    If this was useful, forward it to the partner or family member you co-own property with — the law is already live, and the structure decisions people make in the next few months will be the ones courts test later.

    — Luis


    From the Developer’s Seat

    I want to mark what follows as my view from the developer’s seat, not legal reporting.

    Every few years, Florida changes a rule in a way that looks neutral on paper but quietly tilts the field. The Building Code did it. The insurance reforms did it. The Live Local preemptions did it. And now the Protected Series LLC does it too — because a tool whose entire value depends on disciplined documentation, segregated capital, and competent counsel is, by definition, a tool that favors disciplined, well-advised, professionally-administered capital and disadvantages everyone winging it.

    That’s the same divide I see on the building side of this business. The difference between a structure that holds in litigation and one that collapses is the same difference between a developer who underwrites every assumption and documents every dollar and an operator who doesn’t — and it’s the same standard a family office should demand of whoever holds its Florida exposure. The new law just put that standard into the statute.

    That’s the lane Lana Development builds in — disciplined, code-current, developer-led ground-up new construction across Galleria Villages, Turquoise Homes, Waterview, and West Bay, held and operated to a standard that doesn’t flinch when the rules get more demanding. If you’re a HNWI or family-office investor who wants to see how that discipline shows up in the actual numbers of a live Florida pipeline, reply with “Investor Memo” and I’ll add you to a separate, accredited-only track I run alongside this newsletter.


    FL Real Estate Insider exists to cover the parts of Florida real estate that get glossed over in the brokerage marketing emails. If this helped, hit reply — and if you want a referral to a qualified Florida attorney or CPA to talk through entity structure, I’m happy to point you to one. No pitch attached.


    Sources

  • Why U.S. Real Estate Investment Remains a Smart Choice in 2026 — And Where the Structural Shift Is Real

    For accredited investors, family offices, and international allocators evaluating U.S. real estate investment in 2026, the fundamental question is not whether the asset class is attractive — the data settles that. The real question is where in the U.S. to be, what product to hold, and how to structure the exposure. This article walks through the macro case for U.S. real estate, and then focuses on where the structural shift is most acute and most durable: South Florida coastal.

    The macro case for U.S. real estate investment

    The United States remains the deepest, most transparent, and best-protected real estate market in the world. The Federal Housing Finance Agency’s House Price Index shows steady long-term appreciation across cycles. Property-title systems give both domestic and foreign buyers legally enforceable rights that most global markets simply cannot match. Foreign ownership faces almost no restrictions — a rarity globally.

    Population dynamics are equally supportive. According to the U.S. Census Bureau and IRS Statistics of Income migration data, between 2020 and 2025 net domestic migration to the Sunbelt exceeded 4 million people, with a disproportionately high-income skew. This is not a speculative wave. It is permanent household relocation driven by tax policy, cost-of-living arbitrage, and lifestyle preference.

    But “U.S. real estate is a good investment” is too broad to be actionable. Within the U.S., the outperformance is heavily concentrated. Let’s talk about where and why.

    Florida: the clearest structural shift in U.S. real estate investment

    Florida added more than 1.9 million residents between 2020 and 2025 — the equivalent of adding a city the size of Philadelphia. According to IRS SOI migration data, the average adjusted gross income of movers from New York exceeded $120,000; from Connecticut, $130,000. Florida has now absorbed more than $36 billion in annual adjusted gross income inflow.

    Three drivers make this durable:

    1. The tax advantage is constitutional. Florida requires a legislative supermajority to impose a state income tax. There is no serious political movement to change it. For a household earning $1M annually, the move from New York to Florida is worth roughly $90,000–$110,000 per year in preserved wealth.
    2. Supply cannot keep up. Coastal land is finite. Buildable footprint in Miami-Dade, Broward, and Palm Beach is constrained by ocean, wetlands, conservation areas, and post-Surfside code updates. Permitting runs 8–18 months in most premium submarkets.
    3. Construction costs are up 35–40% since 2020. According to the CoreLogic Construction Cost Index and BLS JOLTS data, labor shortages and material inflation have raised the barrier to new supply significantly — which structurally protects developers who can build at cost.

    Where investors get U.S. real estate investment wrong

    The most common mistake we see accredited investors make is treating “Florida real estate” as a monolith. Central Florida buy-and-flip strategies, Orlando short-term-rental plays, and Miami condo pre-construction each carry very different risk profiles. The strongest fundamentals concentrate in a specific set of coastal submarkets — Brickell and downtown Miami, Fort Lauderdale/Victoria Park corridor, Boca Raton and Deerfield Beach, and select 30A locations — where lifestyle demand, physical supply constraints, and buyer demographics converge.

    At Lana Development, our Coastal Living Collection portfolio strategy targets exactly this convergence: new-construction luxury residential in Florida’s most resilient coastal corridors, with cycles short enough to compound returns and exits structured at delivery rather than through long-term hold.

    The developer question that matters more than the market question

    Once you’ve decided where to be, the second question — who’s building your investment — matters just as much. According to research from the McKinsey Global Institute (“Reinventing Construction”), the average large construction project runs 16% over budget and 20% over schedule. That gap comes directly out of investor returns.

    A developer who outsources construction to a third-party general contractor absorbs a 15–20% GC markup, is exposed to change-order inflation, and has limited real-time visibility into the project. A developer who is itself a licensed general contractor eliminates the markup, controls the timeline, and can course-correct in weeks instead of quarters. On a $12M build, the difference can exceed $3M in preserved value — every dollar of which flows to the project’s return profile.

    This is the single most important structural question an accredited investor should ask about any real estate opportunity, and it is the reason Lana operates as both developer and licensed GC.

    Investment structures every accredited investor should understand

    Once you’ve settled on market and sponsor, the vehicle matters. Broadly, an accredited investor has four choices:

    • Public REITs — liquid, correlated with equity markets, high fees, dilute performance across hundreds of positions.
    • Private funds — blind pools, limited transparency, layered fees, long durations.
    • Traditional syndications — single-asset exposure, but often with promote structures that misalign GP and LP incentives.
    • Direct co-investment with a developer — single project, transparent economics, identical terms as the sponsor, distributions at exit.

    Each has a role. Our view is that direct co-investment with a developer who invests its own capital alongside LPs offers the cleanest alignment for accredited investors — because there is no scenario where the sponsor wins if the LPs don’t.

    Tax and legal considerations for U.S. real estate investment

    Direct ownership of U.S. real estate is broadly open to non-U.S. persons. Structures like LLCs, LPs, and (for certain investors) EB-5 pathways provide flexibility. The tax code allows depreciation to offset rental income, and 1031 exchanges permit deferral into like-kind assets. For foreign investors, tax treaties may minimize double taxation on repatriated proceeds — proper legal and tax counsel is essential and should be secured before any capital moves.

    The bottom line on U.S. real estate investment in 2026

    U.S. real estate remains one of the most durable investment categories in the world. But durability isn’t uniformly distributed. In 2026, the highest-conviction opportunity we see is in the coastal South Florida corridor — where structural demand and structural supply constraint have converged in a way that we don’t expect to reverse this decade. And the sponsor question — outsourced GC vs. in-house GC — matters more than most investors realize.

    If you’d like to talk through how any of this applies to your allocation strategy, schedule a 15-minute conversation with Luis Noronha.

    External sources

  • Housing Market Predictions 2025–2029

    Housing Market Predictions

    Housing Market Predictions for Next 5 Years: 2025 to 2029

    The U.S. housing market stands at a pivotal juncture, shaped by a shifting economic landscape, evolving demographics, and technological disruption. With rising interest rates, changing consumer behavior, and a highly dynamic global context, the market outlook for the next five years—from 2025 to 2029—demands deep analysis and precise forecasting. For real estate developers, investors, and housing policy experts, understanding these dynamics will be critical to capitalizing on opportunities and mitigating risks in residential real estate.

    In this post, we explore expert-driven forecasts on home price trends, geographic growth hotspots, demographic influences, rental market trajectories, and risk factors that are likely to influence the U.S. housing market’s evolution through 2029.

    Home Price Trends and Regional Variations

    After a decade of largely bullish trends in housing prices—punctuated briefly by the market corrections of the early 2020s—the next five years are expected to see more nuanced, regionally diverse growth patterns. According to projections by Fannie Mae and the National Association of Realtors, national home price appreciation will moderate to an annual average of 2.5% to 4%, far below the feverish double-digit growth of 2020-2021.

    However, this cooling will not uniformly affect all markets. Sun Belt cities such as Austin, Phoenix, and Tampa, which experienced explosive growth in the 2020s, may face continued price volatility due to affordability issues and overbuilding. In contrast, mid-size metros in the Midwest—think Columbus, Indianapolis, and Minneapolis—are forecast to emerge as more stable markets with steady year-over-year price growth and increased institutional investment interest.

    Housing affordability will also remain an enduring concern. High mortgage rates—projected to hover between 5.5% and 6.5% through 2029—combined with constrained new housing supply in desirable urban and suburban areas, are likely to keep price-to-income ratios well above historical norms. Market analysts predict a sustained inventory shortage, mainly affecting entry-level homes, which may hinder demand despite buyers’ intent.

    Demographic Drivers and Demand Shifts

    From 2025 through 2029, demographic patterns will exert a powerful influence on both housing demand and design. The maturation of Millennial and early Gen Z cohorts into their peak homebuying years promises a significant baseline of demand. Millennials, many of whom postponed homeownership due to student debt and economic instability, will likely drive the market for both single-family homes and urban condos—especially in lifestyle-centric, affordability-advantaged metros.

    Concurrently, Baby Boomers are downsizing at record levels, reshaping inventory flows and property types coming to market. This generational shift opens avenues for developers focusing on active adult and mixed-use communities tailored for aging residents. Expect a growing demand for aging-in-place features, energy efficiency, and smart home technologies in newly built homes targeting older, mobile populations.

    Meanwhile, immigration policy will play a wildcard role. Should immigration rates recover post-2025 due to policy changes or labor market needs, the influx of new residents can buoy demand in both urban rental markets and first-time buyer segments.

    Rental Market Projections and Multifamily Developments

    The rental housing market, after undergoing significant volatility during the COVID-19 era, is projected to strengthen in the second half of the 2020s. Rising interest rates will push more younger consumers into renting for longer durations. Urban centers offering high-wage job clusters, such as Boston, Seattle, and Denver, are expected to see increased renter demand that outpaces residential construction starts, leading to upward pressure on rents.

    According to the Urban Land Institute, multifamily development will remain a top investment arena for institutional investors, increasingly focused on environmentally certified, tech-enabled, and transit-accessible properties. Suburban build-to-rent (BTR) communities—a hybrid between single-family homes and traditional multifamily—are poised for rapid expansion, serving middle-income households priced out of ownership yet seeking space and amenities.

    Land use reform and zoning changes at the municipal level could further accelerate multifamily construction. Cities such as Minneapolis, Portland, and Charlotte have already begun implementing reforms to permit higher-density projects in traditionally single-family zones, paving the way for new development pipelines that align with changing societal norms and sustainability imperatives.

    Technological Disruption and Infrastructure Development

    Technology will continue to reshape the housing development landscape between 2025 and 2029. Proptech innovations—including AI-driven valuation tools, blockchain-enabled property transactions, and digital twin modeling—will enhance project viability analyses, streamline sales, and reduce costs. Automation in construction, like 3D-printed housing components and modular prefabrication, will play pivotal roles in addressing labor shortages and affording faster project timelines.

    Broadband expansion and remote work adoption will also shift geographical demand. Second-tier and “Zoom Town” markets—such as Bozeman, Chattanooga, and Spokane—will thrive as viable alternatives for professionals seeking lifestyle affordability without sacrificing connectivity or amenities. Infrastructure investments authorized under the 2021 Infrastructure Investment and Jobs Act will further catalyze residential development in previously underutilized growth corridors, especially near new transit lines or logistics hubs.

    Key Risks and Market Uncertainties

    No housing market forecast is complete without considering downside scenarios. The most salient risks facing the housing market through 2029 include:

    • Interest Rate Volatility: The possibility of higher-than-expected inflation or sustained monetary tightening could lead to prolonged periods of elevated borrowing costs, reducing affordability and slowing transaction volumes.
    • Geopolitical Disruptions: Global instability—whether from armed conflicts, climate-related migration shocks, or commodity price instability—could reverberate through capital markets and affect construction costs and buyer sentiment.
    • Regulatory Constraints: Housing development continues to be heavily localized, subject to zoning, permitting, and NIMBY opposition. Delayed entitlements, litigation, and construction hurdles will challenge timeline and cost structures, particularly in high-demand urban cores.
    • Climate Risk: Increasingly, climate change is shaping both insurance pricing and development feasibility. Markets vulnerable to hurricanes, wildfires, or water scarcity (e.g., Florida, California, Arizona) may see declining investor appetite, while “climate-resilient” cities could ascend in strategic prominence.

    Investment Opportunities for Developers and Stakeholders

    Despite a moderated growth landscape, opportunities abound for stakeholders who align their strategies with demographic realities, technological shifts, and local policy trends. Key investment themes anticipated between 2025 and 2029 include:

    • Attainable Housing: Developing mid-tier homes with efficient footprints, shared amenities, and affordability incentives will address acute shortages and appeal to underserved segments.
    • Mixed-Use Communities: Projects that integrate housing with retail, wellness, and co-working spaces will thrive in both post-pandemic urban design and aging-in-place scenarios.
    • Green and Healthy Buildings: ESG-focused investors are increasingly demanding carbon-neutral construction, indoor air quality optimization, and renewable energy integration—all poised to become development hygiene factors rather than differentiators.
    • Adaptive Reuse: Converting underutilized commercial stock (office buildings, malls, warehouses) into housing offers lower acquisition costs and aligns with sustainability goals and municipal revitalization programs.

    Conclusion: Navigating a Balanced Yet Dynamic Market

    The next five years in the U.S. housing market will present a more measured pace of growth than the frenetic peaks and valleys of the early 2020s. For real estate professionals, success will hinge on carefully navigating macroeconomic forces, embracing innovative technology, and anticipating shifting consumer preferences. Geographic and strategic differentiation will become increasingly essential as uniform national trends give way to localized cycles based on infrastructure, policy, and climate profile.

    Ultimately, the housing market from 2025 to 2029 promises fewer windfalls, but greater resilience—where those who prioritize long-view planning, sustainability, and adaptability will emerge as the sector’s next-generation leaders.

    External Sources

  • Urban Living Trends: The Future of Real Estate

    Urban Living Trends: The Future of Real Estate

    Urban living trends in real estate

    Introduction

    The real estate market is undergoing a significant transformation driven by evolving consumer preferences, technological advancements, demographic shifts, and the impact of global events. This article examines the current trends in urban living, with a particular focus on the growing demand for sustainable development, mixed-use spaces, and smart home technology. By understanding these trends, investors, developers, and homeowners can make informed decisions in today’s dynamic real estate landscape.

    The Rise of Sustainable Development

    Sustainability has emerged as a critical focus in real estate, with urban dwellers increasingly prioritizing environmentally friendly living spaces. This trend aligns with a broader societal shift toward sustainability as individuals and communities become increasingly aware of the impact of climate change and the importance of reducing their carbon footprints.

    Green Building Practices

    The construction industry is responding to this demand by integrating green building practices into new developments. These practices include utilizing eco-friendly materials, optimizing energy efficiency, and implementing renewable energy sources such as solar panels. According to the U.S. Green Building Council, buildings that adhere to sustainable standards can significantly reduce energy and water consumption, resulting in lower operational costs for both homeowners and tenants.

    Urban Green Spaces

    Moreover, urban planners are increasingly incorporating green spaces into city designs. Parks, green roofs, and community gardens not only enhance aesthetic appeal but also promote mental well-being and community interaction. A study published in the journal “Environmental Science & Technology” indicates that access to green spaces can improve residents’ quality of life, making them a desirable feature in residential developments.

    The Popularity of Mixed-Use Developments

    Another notable trend in the real estate market is the rise of mixed-use developments. These projects integrate residential, commercial, and recreational spaces into a single area, fostering a sense of community and convenience.

    Benefits of Mixed-Use Living

    Mixed-use developments cater to the modern consumer’s desire for walkability and accessibility. As urban populations grow, residents increasingly seek neighborhoods where they can live, work, and play without the need for extensive commuting. This trend is particularly evident in metropolitan areas where traffic congestion and long commutes have become significant concerns.

    Case Studies: Successful Mixed-Use Projects

    Cities such as New York, San Francisco, Miami, and Toronto have seen a surge in mixed-use developments. For instance, the Hudson Yards project in New York City exemplifies how integrating residential, commercial, and public spaces can create a vibrant community hub. Such developments not only attract residents but also enhance local economies by fostering business growth and increasing foot traffic.

    The Influence of Smart Home Technology

    As technology continues to evolve, smart home innovations are becoming increasingly prevalent in the real estate market. Homebuyers are now looking for properties equipped with smart technologies that enhance convenience, security, and energy efficiency.

    Features of Smart Homes

    Smart home technology encompasses devices such as smart thermostats, security systems, lighting controls, and home automation systems that can be remotely managed via smartphones. According to a report by the Consumer Technology Association, nearly 75% of U.S. households own at least one smart home device, indicating a growing consumer preference for tech-enhanced living environments.

    Implications for Real Estate

    For real estate developers, incorporating smart technology into new constructions can significantly increase property value and appeal to tech-savvy buyers. As demand for such features rises, properties equipped with smart technology are likely to command higher prices and attract a broader range of prospective buyers.

    Demographic Shifts and Urbanization

    Demographic trends, particularly the movement of millennials and Gen Z into urban areas, are reshaping the real estate market. Younger generations prioritize experiences over ownership, leading to increased demand for rental properties and smaller living spaces that offer flexibility and access to urban amenities.

    The Impact of Remote Work

    The COVID-19 pandemic has accelerated the shift towards remote work, prompting many individuals to reconsider their living arrangements. With the ability to work from anywhere, some are opting for suburban or rural living, seeking larger homes at lower costs. However, urban centers remain attractive due to their rich cultural offerings, diverse job opportunities, and strong social connectivity.

    Housing Affordability Challenges

    As urban areas continue to experience population growth, housing affordability has become a pressing issue. Many cities are grappling with how to provide affordable housing options while maintaining the character and vibrancy of their neighborhoods. Policymakers and developers are tasked with creating solutions that effectively address both supply and demand.

    Conclusion

    The real estate market is witnessing a profound evolution shaped by sustainability, technological advancements, and demographic shifts. The trends toward sustainable development, mixed-use living, and smart home technology reflect the changing preferences of urban dwellers, who seek convenience and a high quality of life. As these trends continue to develop, stakeholders in the real estate market must adapt their strategies to meet the demands of a new generation of homeowners and renters, ensuring that urban living remains accessible, attractive, and sustainable.

    Sources:
    IoT | Sieze Today. https://siezetoday.com/tag/iot/

    The Future of Composite Materials in Aerospace Industry: Emerging Trends and Innovations – SMI Composites. https://www.smicomposites.com/the-future-of-composite-materials-in-aerospace-industry-emerging-trends-and-innovations/
    Rebecca Wyatt – PARCEL Industry. https://parcelindustry.com/by-author-1507-1.html
    Sustainable Urban Planning: Building Livable Cities for the Future – Geeklybee. https://www.geeklybee.com/sustainable-urban-planning/
    Cao, Y., Song, X., & Wang, T. (2015). Development of an Energy-Aware Intelligent Facility Management System for Campus Facilities. Procedia Engineering. https://doi.org/10.1016/j.proeng.2015.08.446
    U.S. Green Building Council Announces Recipients of 2023 LEED Homes Awards | Weber Thompson. https://www.weberthompson.com/u-s-green-building-council-announces-recipients-of-2023-leed-homes-awards/
    Building Inclusive Cities: A Vision for Accessible and Equitable Urban Development. https://reflections.live/articles/18210/building-inclusive-cities-a-vision-for-accessible-and-equitable-urban-development-article-by-kamakshi-srimal-18923-m3stdvxe.html
    Canadian study finds banned cancer-causing chemicals in 88% of household products. https://health.news/2023-04-26-carcinogens-found-in-88percent-of-household-products.html
    The Current Real Estate Market Trends | CCW Photos. https://ccwphotos.com/29781-the-current-real-estate-market-trends-20/
    9 Trends Defining the Future of Luxury Homes – Luxarc. https://www.luxarc.in/blogs/news/9-trends-defining-the-future-of-luxury-homes
    Transform Your Space: Exploring the Latest Home Decor Trends of 2023 -. https://advantage1mtg.com/3452/transform-your-space-exploring-the-latest-home-decor-trends-of-2023
    Top 7 Features of Smart Homes Creating Trends in Real Estate | Elliot Adler. https://elliotadler.bravesites.com/entries/general/Top-7-Features-of-Smart-Homes-Creating-Trends-in-Real-Estate
    Nine Home Improvements to Modernize a Fixer-Upper – Merriment Maker by Uncustomary. https://uncustomary.org/nine-home-improvements-to-modernize-a-fixer-upper/
    Advanced Television | Tag Archive | nextgen. https://advanced-television.com/tag/nextgen/
    Why Build a Private Guest House on Your Property?. https://eastonhomes.com/blog/why-build-private-guest-house/
    (2023). Recognizing Excellence: Women in Secured Finance Profiles. The Secured Lender, 79(2), 14-16,18.
    Techsalerator. https://www.techsalerator.com/use-cases/urban-planning-and-infrastructure-development
    Technology Trends Transforming Freight Operations. https://www.technologytimesnow.com/technology-trends-transforming-freight-operations/

  • The One Big Beautiful Bill Boosts Impact for Real Estate Investors

    In mid-2025, Congress introduced what’s being called the One Big Beautiful Bill—a sweeping tax reform package aimed at reigniting economic growth, incentivizing investment, and easing burdens on individuals and businesses alike. For real estate investors and developers, this legislation represents more than just another tax cut—it is a potential game-changer.

    With targeted provisions benefiting property developers, syndicators, and even passive investors, the bill’s real estate-friendly measures offer new tools to boost profitability, unlock liquidity, and optimize long-term strategies. In this article, we’ll unpack the most relevant parts of the bill and explain how each can positively affect real estate investing in the coming years.

    1. 100% Bonus Depreciation Extended (and Expanded)

    One of the most powerful tools in the investor’s tax toolbox is bonus depreciation, and the Big Beautiful Tax Cut gives it a significant revival. Originally set to phase out after 2026, the bill extends 100% bonus depreciation through 2029. Even more significantly, it expands the list of eligible property and reintroduces enhanced Section 179 expensing limits, raising the cap to $2.5 million (phasing out at $4 million).

    Why This Matters:

    For developers and property owners, bonus depreciation allows for immediate deduction of the full cost of qualifying improvements, such as appliances, HVAC systems, roofing, and other building components. Typically, these items would be depreciated over 5, 15, or even 39 years.

    By deducting them in the first year, investors can significantly reduce taxable income, improving short-term cash flow and increasing the internal rate of return (IRR). This is especially impactful for value-add projects or new developments where heavy capital expenditures occur early in the investment cycle.

    Practical Example:

    Suppose a developer spends $600,000 on qualified improvements across a portfolio of rental properties. In that case, they can deduct that full amount in the first year rather than over decades, saving as much as $200,000 in taxes depending on their tax bracket.

    2. SALT Deduction Cap Raised

    The bill loosens the controversial State and Local Tax (SALT) deduction cap introduced in the 2017 Tax Cuts and Jobs Act. That law limited SALT deductions to $10,000, disproportionately hurting taxpayers in high-cost states like New York, California, and Florida. The new legislation raises the cap significantly, to $30,000 or even $40,000, depending on the version of the bill and income levels.

    Why This Matters:

    Real estate professionals and high-net-worth individuals who invest through pass-through entities often report their income on personal returns. The new SALT deduction cap offers meaningful relief—especially for investors based in high-tax states—by allowing more of their state and local taxes to be deducted at the federal level, thereby reducing overall taxable income.

    Investor Takeaway:

    With larger SALT deductions, net after-tax returns improve. For sponsors marketing high-end or urban projects, this also improves the financial picture for potential investors deciding between asset classes.

    3. Qualified Business Income (QBI) Deduction Improved

    The QBI deduction under Section 199A has been a significant benefit for investors and developers operating through LLCs, S corporations, or partnerships. The Big Beautiful Tax Cut increases this deduction from 20% to 23% of qualified business income after 2025.

    Why This Matters:

    A higher QBI deduction increases the effective return for investors who receive income from rental activities classified as a qualified trade or business. This extra 3% might seem minor, but it adds up, especially for those with seven- or eight-figure income from real estate operations.

    Strategic Implication:

    Sponsors should consider revisiting their entity structures to maximize QBI eligibility, especially for joint ventures and development deals where income distributions can be optimized.

    4. Opportunity Zones Extended with Enhancements

    Initially established in 2017, Opportunity Zones (OZs) have driven billions in investment into underserved communities. The Big Beautiful Tax Cut extends the OZ program through 2033. It introduces enhancements aimed at rural areas, as well as long-term holding benefits.

    Key updates include:

    • 30% basis step-up after 5 years (up from 10% at 5 years previously) for rural OZs
    • Expanded eligibility for zones in tribal and economically distressed areas
    • Greater clarity on reporting and compliance requirements

    Why This Matters:

    The enhancements create a fresh incentive for developers to look outside major metros for projects in rural or emerging markets. Investors get greater tax deferral and permanent capital gains exclusion benefits for qualified OZ investments.

    Long-Term View:

    For firms with experience in secondary markets, this presents an excellent opportunity to pursue affordable housing, hospitality, or mixed-use projects in underutilized areas, now with enhanced tax incentives to support them.

    5. Enhanced Low-Income Housing Tax Credit (LIHTC)

    Affordable housing developers have long relied on the LIHTC to bring equity into deals that may otherwise be financially infeasible. The new tax law increases the 9% credit allocation by 12.5% from 2026 to 2029 and reduces the 4% credit bond-financing threshold from 50% to 25%.

    Why This Matters:

    These changes make it easier to qualify and raise capital for LIHTC-funded projects. Developers working on affordable or mixed-income housing can now access larger equity contributions from syndicators or institutional partners.

    The 25% bond financing threshold makes it easier for smaller or more complex projects to get approved, reducing project delays and allowing for faster execution.

    6. Passive Activity and Business Interest Deduction Clarifications

    The bill also refines the business interest expense limitation rules under Section 163(j), reintroducing the ability to add back depreciation and amortization, at least through 2029.

    Additionally, the excess business loss limitations for non-corporate taxpayers were retained but clarified in favor of certain real estate activities.

    Why This Matters:

    Investors using leverage as a growth tool will benefit from more favorable treatment of interest expense, especially in capital-intensive development or syndication structures. The ability to fully deduct interest improves project feasibility and post-tax returns.

    7. New Withholding Rules for Foreign Investors

    Foreign investors play a critical role in U.S. real estate, particularly in gateway cities and large-scale commercial developments. The new bill introduces withholding requirements ranging from 5% to 20% on capital repatriation from certain U.S. real estate investments.

    Why This Matters:

    While this introduces more administrative work and potential delays in repatriation, it also increases regulatory clarity. For developers working with foreign limited partners (LPs), the new withholding rules can be built into the project’s waterfall and modeled accordingly.

    It’s essential to note that these provisions do not eliminate the appeal of U.S. real estate for international investors. The U.S. remains a stable, appreciating, and dollar-denominated market, now with more explicit rules for taxation and compliance.

    Final Thoughts: A Golden Window for Real Estate Investment

    While the political future of the bill remains uncertain, one thing is clear: the tax code is leaning in favor of real estate, and savvy investors should act accordingly. Whether it’s capturing faster depreciation, unlocking capital in Opportunity Zones, or restructuring pass-through entities to maximize deductions, the legislation offers a compelling case for reassessing strategy.

    Of course, it’s not without complexity. Developers and investors will need to work closely with tax advisors, legal counsel, and underwriters to ensure full compliance and maximize the benefit of each provision.

    However, overall, the Big Beautiful Tax Cut presents real estate professionals with a rare opportunity to increase after-tax returns, access new capital, and expand into previously underutilized markets. With the right structure and timing, the benefits could echo throughout the next investment cycle.